Forex Signals March 12: Adobe, Dollar General, USAR Rare Earth Earnings Preview Today
Today's earnings releases from Adobe, Dollar General, and USA Rare Earth are being eagerly watched by investors, who anticipate that the...
•
Last updated: Thursday, March 12, 2026

Quick overview
- Investors are monitoring earnings reports from Adobe, Dollar General, and USA Rare Earth for insights into technology, retail, and critical minerals sectors.
- The February Consumer Price Index (CPI) report indicates stable inflation, with year-over-year headline CPI at 2.4% and core CPI at 2.5%.
- Crude oil prices surged despite recommendations for strategic reserve releases, raising concerns about potential supply disruptions due to geopolitical tensions.
- The U.S. dollar strengthened amid rising Treasury yields, while equity markets showed mixed performance, reflecting cautious investor sentiment.
Today’s earnings releases from Adobe, Dollar General, and USA Rare Earth are being eagerly watched by investors, who anticipate that the results will shed light on the state of the technology, retail, and vital minerals industries.
U.S. Inflation Holds Steady in February
The latest February Consumer Price Index (CPI) report showed inflation broadly in line with expectations, reinforcing the view that price pressures remain stable but have not yet convincingly moved lower. Headline CPI rose 2.4% year-over-year, matching forecasts and unchanged from the previous month. On a monthly basis, prices increased 0.3%, slightly higher than January’s 0.2% gain, but still consistent with a gradual cooling trend.
Core CPI, which excludes the more volatile food and energy categories, held at 2.5% year-over-year, while the monthly core reading slowed to 0.2%, down from 0.3% previously. While the report confirmed that inflation is no longer accelerating, it also suggests that the path toward lower inflation remains uneven.
Persistent Price Pressures in Key Sectors
Despite the overall stability in inflation, several categories continued to show notable price increases. Restaurant prices rose 3.9% year-over-year, while medical care costs climbed 4.1%. Energy-related components also remained elevated, with electricity prices up 4.8% and utility gas surging 10.9% annually.
Because most figures aligned closely with expectations, financial markets reacted only modestly to the report. However, attention is already shifting toward the March CPI data, which may begin to reflect the recent surge in oil prices tied to geopolitical tensions involving Iran. Rising energy costs could reintroduce upward pressure on inflation.
Traders are also focused on how the data may influence Personal Consumption Expenditures (PCE) inflation, the Federal Reserve’s preferred inflation gauge.
Oil Prices Surge Despite Strategic Reserve Talk
Crude oil prices climbed $4.30, or about 5.15%, even after the International Energy Agency (IEA) recommended releasing 400 million barrels from strategic reserves. Markets remain skeptical that reserve releases alone can offset potential supply disruptions linked to tensions around the Strait of Hormuz, one of the world’s most critical oil shipping routes.
Higher oil prices have pushed U.S. Treasury yields higher, as bond traders worry that renewed energy inflation could complicate the Federal Reserve’s policy outlook.
Geopolitical Tensions Keep Markets Cautious
Geopolitical uncertainty remains elevated as the U.S.–Israel conflict with Iran continues. President Donald Trump stated that the U.S. military campaign is “way ahead of schedule,” suggesting the operation could conclude soon. He also indicated that multiple Iranian military and infrastructure targets have already been destroyed.
Despite this optimistic tone, reports suggest that military planning could still involve additional weeks of strikes, leaving uncertainty about how quickly the conflict may end. The primary concern for global markets remains the security of shipping through the Strait of Hormuz, a vital chokepoint for global energy supply.
Dollar Strength and Mixed Equity Performance
In currency markets, the U.S. dollar strengthened against most major currencies, supported by rising Treasury yields and continued geopolitical risks. Investors have favored the dollar as a safe-haven asset amid uncertainty.
U.S. equity markets ended the session mixed. The Nasdaq managed a modest gain, supported by strength in technology stocks, while the Dow Jones and Russell 2000 declined. The S&P 500 finished little changed, reflecting a balance between gains in energy and technology shares and weakness across consumer and financial sectors as investors remain cautious.
Key Market Events to Watch Today
Today’s earnings calendar highlights three very different sectors of the economy—technology, retail, and strategic minerals. Results from Adobe will offer clues about AI-driven software demand, Dollar General’s report will shed light on consumer spending trends in a challenging economic environment, and updates from USA Rare Earth will help investors gauge the long-term growth potential of the critical minerals industry. Together, these reports could provide valuable signals about the direction of several key parts of the market.
Adobe Inc. – Q1 2026 Earnings (After Market Close)
Adobe will release its first-quarter fiscal 2026 earnings after the market closes (AMC).
- Expected EPS: $5.87
- Market Capitalization: Approximately $112.36 billion.
Key points investors will watch:
- Growth in Adobe’s AI-powered tools, particularly within its Creative Cloud and Firefly generative AI ecosystem.
- Continued adoption of AI-enhanced design and content creation software by enterprises and digital creators.
- Updates on subscription growth across Creative Cloud and Document Cloud products.
- Any commentary on competition in the generative AI design space, which has intensified as new AI tools enter the market.
Market context:
- Adobe shares have recently faced some pressure amid broader concerns that AI-native design tools could disrupt traditional software models.
- Investors will be looking for reassurance that Adobe’s AI strategy is translating into strong monetization and user growth.
Dollar General – Q4 2025 Earnings (Before Market Open)
Dollar General will report fourth-quarter 2025 earnings before the market opens (BMO).
- Expected EPS: $1.50
- Market Capitalization: Approximately $31.88 billion.
Key themes to monitor:
- Consumer spending trends among lower-income households, which make up a large portion of Dollar General’s customer base.
- The impact of inflation and higher interest rates on discount retail demand.
- Updates on store expansion plans and operational efficiency initiatives.
- Performance of private-label brands and grocery categories, which have become increasingly important revenue drivers.
Market context:
- Discount retailers like Dollar General often benefit during economic slowdowns, as consumers shift toward value-oriented shopping options.
- However, the company has also faced cost pressures and margin challenges related to logistics, wages, and inventory management.
USA Rare Earth – FY 2025 Financial Update
USA Rare Earth is also drawing attention from investors as interest in critical minerals and rare earth supply chains continues to grow.
- Market Capitalization: Approximately $4.46 billion.
- Fiscal 2025 EPS: around –$0.12, reflecting continued investment and development spending.
Key areas of interest:
- Progress on domestic rare earth mining and processing capacity in the United States.
- Updates on strategic partnerships and supply agreements, particularly related to electric vehicles, defense technology, and renewable energy industries.
- Government policy developments supporting critical mineral independence from foreign supply chains.
Market context:
- Rare earth companies have attracted increasing investor attention due to their importance in EV batteries, semiconductors, and advanced defense systems.
- The sector remains capital-intensive and early-stage, meaning profitability timelines may still be several years away.
Gold Finds Support at the 20 SMA
Although demand for safe haven assets is still high, gold fell precipitously from record highs following the Fed’s most recent rate cut comments, as profit-taking was prompted by Powell’s cautious tone. In December, gold jumped above $4.3800 following the Federal Reserve’s announcement of a 25 basis point rate decrease. But the impetus soon waned, and prices dropped back to $4,004. The 20 daily SMA (gray) held as support last week and buyers returned and pushed XAU above the $5,000 mark for the first time, printing a fresh record high at $5,598 before retreating below $5,000. But buyers returned and XAU climbed above $5,000 again.
USD/JPY Rebounds
Foreign exchange markets saw sharp swings. Early in the week, U.S. yield differentials and Japanese capital outflows pushed the dollar above ¥150, but disappointing U.S. jobs data triggered profit-taking, causing the USD/JPY to slide by four yen from its peak. However, the new BOJ governor the JPY has weakened and USD/JPY soared to 154 and we decided to close our buy signal for more than 80 pips as the pair found support at the 20 daily SMA (gray) and has rebounded more than 200 pips off that MA but reversed after the 25 bps rate cut from the FED. The price approached $160 but reversed after the BOJ meeting and fell 8 cents but found support at $152 at the 100 daily SMA (red) and rebounded above 156 but have reversed down again this week after the Japanese elections.
USD/JPY – Daily Chart
Cryptocurrency Update
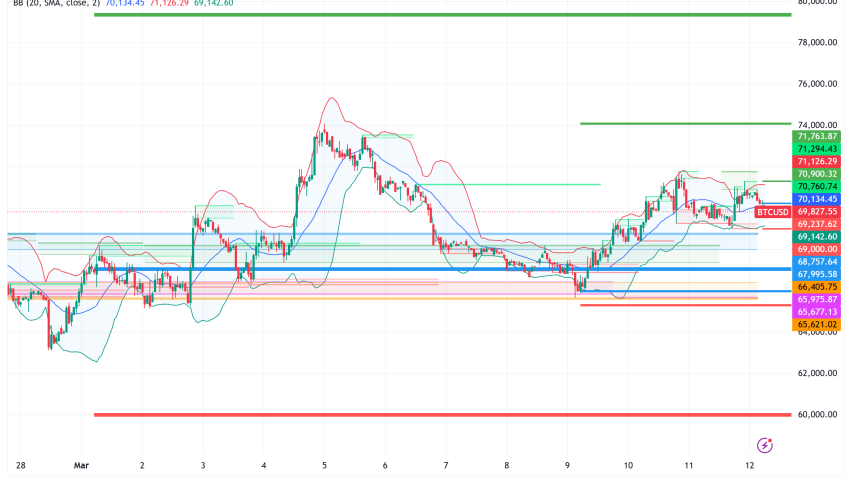
Bitcoin Reclaims the $70K Level
Cryptocurrencies remained highly active over the summer. Bitcoin (BTC) climbed to fresh highs of $123,000 and $124,000 in July and August, supported by institutional inflows and technical strength. However, remarks from Treasury Secretary Scott Bessent ruling out U.S. increases to BTC reserves triggered a steep pullback, sending the coin down to $80K before finding support at the 100 weekly SMA (green). A rebound followed, sending BTC near $100 is the first major text for Bitcoin buyers. However BTC returned lower and fell below $80K, breaking below the but the 100 weekly SMA (green) but the decline stopped at the $60K support where the 200 weekly SMA (purple) stands and rebounded to $74K.
BTC/USD – Weekly Chart
Ethereum Climbs Above $2,000
Ethereum (ETH) has been similarly strong, surging toward $4,800, its highest since 2021 and near its all-time peak of $4,860. Despite a dip last week, ETH found support at the 20-day SMA, with retail enthusiasm and renewed institutional participation driving fresh upside momentum. Last week we saw a dive below $2,000 but buyers returned n d pushed the price above $2K again.
ETH/USD – Weekly Chart
- Check out our free forex signals
- Follow the top economic events on FX Leaders economic calendar
- Trade better, discover more Forex Trading Strategies
- Open a FREE Trading Account
- Read our latest reviews on: Avatrade, Exness, HFM and XM
ABOUT THE AUTHOR
See More
Skerdian Meta
Lead Analyst
Skerdian Meta Lead Analyst.
Skerdian is a professional Forex trader and a market analyst. He has been actively engaged in market analysis for the past 11 years. Before becoming our head analyst, Skerdian served as a trader and market analyst in Saxo Bank's local branch, Aksioner. Skerdian specialized in experimenting with developing models and hands-on trading. Skerdian has a masters degree in finance and investment.
Related Articles


Sidebar rates
Related Posts
