Gold Price Crash: Is the $4,300 Floor Strong Enough to Stop the 21% Bleed?
The gold market is going through its most intense shakeout in decades. As of March 24, 2026, spot gold (XAU/USD) is struggling...
Quick overview
- The gold market is experiencing significant volatility, with spot gold prices dropping over 21% from a record high of $5,603 to between $4,340 and $4,370 per ounce.
- The US-Israel-Iran conflict initially drove prices up, but rising oil prices and inflation concerns have shifted market sentiment.
- While speculative traders are selling off positions, central banks, particularly in BRICS nations, are viewing the current price weakness as an opportunity for long-term accumulation.
- Major investment banks maintain a positive long-term outlook for gold, with J.P. Morgan projecting a year-end target of $6,300 despite current market pressures.
The gold market is going through its most intense shakeout in decades. As of March 24, 2026, spot gold (XAU/USD) is struggling, trading between $4,340 and $4,370 per ounce. Only weeks ago, gold reached a record high of $5,603 in late January, but it has since dropped more than 21%. Analysts are calling this a ‘paper market flush.’ The US-Israel-Iran conflict first pushed prices higher, but the resulting surge in oil prices to nearly $108 per barrel has changed the story from a ‘safe-haven bid’ to concerns about inflation.
Partial closures in the Strait of Hormuz have caused an energy shock, putting pressure on the Federal Reserve. Rather than cutting rates as expected in 2026, the market now expects rates to stay steady at 3.50% to 3.75%. This has pushed the US Dollar to its highest levels in months and made gold less attractive since it does not pay interest**.**
Technical Breakdown: Fibonacci Levels and the 200-Day EMA
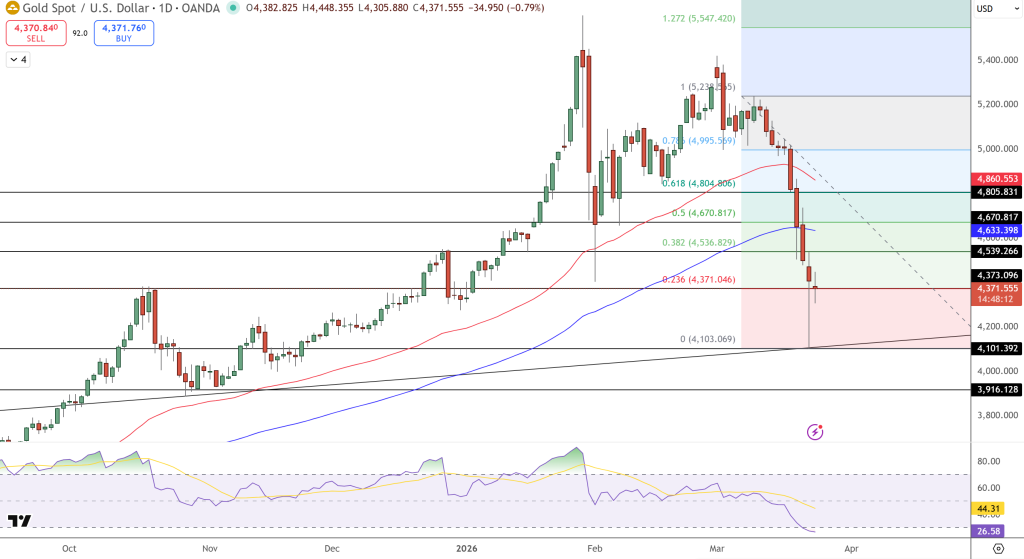
The daily chart shows significant technical damage. Gold has quickly fallen through several important support levels. After dropping below the 0.382 Fibonacci retracement at $4,938, the sell-off picked up speed. The 50-day Moving Average at $4,960 is now well above the current price and acts as a strong resistance.
Right now, the price is moving between the 0.618 Fibonacci level at $4,528 and the 0.786 level at $4,163. The Relative Strength Index (RSI) has dropped to 27, which is considered deeply oversold and often points to a possible short-term rebound. Many traders are closely watching the 200-day Exponential Moving Average (EMA) near $4,200. If gold falls below this level, it could mean the market is moving from a normal correction to a long-term downturn.
Central Bank Divergence: Structural Buying vs. Tactical Sales
Even though the futures market is under heavy pressure, the story for physical gold demand is more mixed. Speculative traders are selling off their positions to cover losses elsewhere, but central banks are taking a longer-term approach.
- The BRICS Accumulation: Led by Brazil and India, BRICS-aligned nations are continuing their de-dollarization strategies, viewing current price weakness as a strategic entry point.
- The “Sanctions-Proof” Hedge: Physical gold reserves of over 8,100 tonnes in the US and 2,300 tonnes in China highlight the metal’s role as a sovereign insurance policy that cannot be “digitally frozen.”
- Slowing Momentum: The World Gold Council reported that net gold purchases fell to 5 tonnes in January, much lower than the average in 2025. This means that while there is still a base level of demand, the rush to buy gold at any price has slowed down compared to last year.
The Q4 2026 Outlook: From $4,300 to $6,300?
The market is under a lot of stress right now, and some media sources are comparing this week’s volatility to the 1983 crash. Still, major investment banks are sticking to their positive outlook for gold in the long run. J.P. Morgan, for example, keeps its year-end target at $6,300. They believe that after the initial financial pressure from the Iran conflict eases, the ongoing mix of high inflation and slow growth will support higher gold prices.
The recent five-day ceasefire announced by the US has temporarily eased tensions, helping gold stabilize around $4,370. Traders should watch for the S&P Global Flash PMI data on March 26. If the data is strong, it could support the idea that the Federal Reserve will keep rates high, possibly pushing gold down toward $4,200. If the data is weak, it might lead to a sharp rebound in gold prices toward $4,540.
- Check out our free forex signals
- Follow the top economic events on FX Leaders economic calendar
- Trade better, discover more Forex Trading Strategies
- Open a FREE Trading Account
- Read our latest reviews on: Avatrade, Exness, HFM and XM
Related Articles

Sidebar rates
Related Posts
