Bitcoin Price Prediction: BTC’s $70,000 Tug-of-War: Will the $1 Billion Institutional Bid Spark a $75,000 Breakout?
The King of Cryptocurrencies is currently stuck in a nail-biting consolidation phase that has the whole financial world on its toes...
Quick overview
- Bitcoin is currently consolidating between $70,000 and $71,300, showing resilience amid Middle East volatility.
- The recent 2% bounce in Bitcoin's price is driven by hopes for de-escalation in the Iran conflict, boosting market confidence.
- Technical analysis indicates Bitcoin is at a critical demand zone around $69,112, with resistance levels above complicating upward movement.
- Institutional support from firms like BlackRock and Morgan Stanley is expected to bolster Bitcoin's market position as regulatory clarity approaches.
The King of Cryptocurrencies is currently stuck in a nail-biting consolidation phase that has the whole financial world on its toes. As of March 26, 2026, Bitcoin is bouncing around in a tight little channel between $70,000 and $71,300, taking the heat from the Middle East volatility without so much as a wobble. Earlier this week, a brief freakout sent prices plummeting toward $67,500 – but so far, so good: Bitcoin’s right back up over that important $70,000 line , which tells us the digital gold narrative is having a bit of a head-to-head battle with reality right now.
The Geopolitical Pivot: Why Peace Talks are Powering BTC
Its the Iran conflict narrative that’s the real driver of Bitcoins 2% bounce back today. With hopes for a de-escalation starting to emerge from the US on this 15 point ceasefire proposal, oil prices have backed off a bit from their $113 peaks. And with those energy-driven inflation worries on the backburner, its fair to say that Wall Street is feeling a bit more confident.
Thing is, Bitcoin is looking more and more like the ultimate indicator of global liquidity. And while gold went up initially on all those war fears, Bitcoins recent bounce is closely tied to the recovery in equity futures. Its looking like the market is betting that we’re going to see a diplomatic breakthrough that will keep a stagflationary disaster at bay – which in turn lets the Federal Reserve keep things pretty predictable for 2026.
Bitcoin Technical Analysis: The $69,112 Demand Zone Battle
On the 2 hour chart, Bitcoin’s price action looks suspiciously like it’s building up to a huge explosion in volatility. The technical picture still looks pretty good, as long as things hold up at a certain key level.
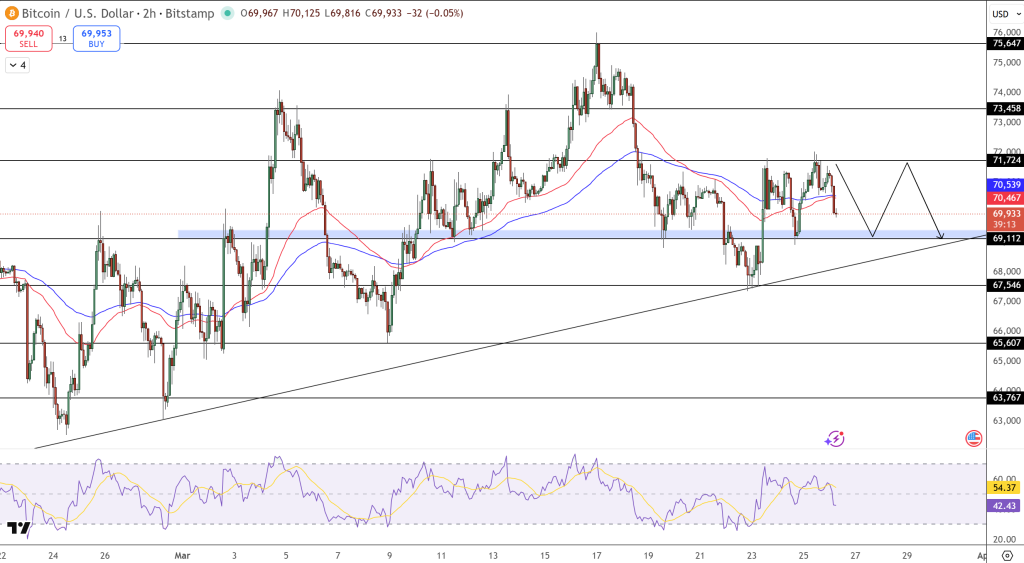
- That Ascending Trendline: Bitcoin is still respecting the trendline that grew out of the February lows at $63,767 – and it’s now butting up against the $69,112 demand zone, which is probably as strong a floor as the bulls are going to get.
- Resistance Overhead: Right on top of us, between $71,724 and $73,458, there’s a lot of resistance. The 50 period EMA ($70,467) and the 200 period EMA ($70,539) are kind of “pulling” the price back and keeping Bitcoin pretty stuck in neutral.
The RSI is currently sitting at about 54, which means the momentum is perfectly balanced. That’s not a bad thing – it just means the market is waiting for some new news, probably something coming out of Tehran, or some fresh ETF flow data, to decide which way to go next.
The Institutional Floor: BlackRock and Morgan Stanley Lead the Charge
There’s arguably less chance of institutional support holding up Bitcoin in 2026 than you might think though the spot Bitcoin ETFs, with BlackRock’s IbIT at the forefront, have managed to keep steady net inflows even with all the geopolitical mayhem going on. We also have to factor in the impending launch of Morgan Stanley’s spot ETF (MSBT), which should probably get a lot more registered investment advisors into the game – especially those who’ve so far been sitting on the sidelines waiting for this exact moment to jump in.
We’re getting close to seeing the US Senate agree on some crypto market legislation now and that’s likely to finish off the idea that Bitcoin is in a bad regulatory spot once and for all. Lots of analysts reckon as long as that $69,112 price level holds firm on a daily close we’ll be heading straight back up to test that $76,000 all time high again.
- Check out our free forex signals
- Follow the top economic events on FX Leaders economic calendar
- Trade better, discover more Forex Trading Strategies
- Open a FREE Trading Account
- Read our latest reviews on: Avatrade, Exness, HFM and XM
Related Articles
Sidebar rates
Related Posts
