Silver Price Forecast: $100 Dream or $60 Nightmare? XAG/USD Battles for Survival at $72
The silver market is currently careening through a particularly turbulent period in modern history. By March 26, 2026...
Quick overview
- The silver market is experiencing significant volatility, with spot silver prices at $72.11 per ounce after a 40% decline from January highs.
- Recent geopolitical developments, particularly a ceasefire proposal in the Iran conflict, have diminished silver's appeal as a safe haven asset.
- Technical analysis indicates a bearish trend for silver, with resistance at $74.00 and critical support at $70.00.
- Despite current challenges, long-term forecasts for silver remain optimistic due to persistent supply deficits and increasing industrial demand.
The silver market is currently careening through a particularly turbulent period in modern history. By March 26, 2026, the going rate for spot silver is clinging to $72.11 per ounce – which is a fairly wobbly 3.6% bounceback from the ugly mid-month downturn that just about everyone was dreading. As little as a couple of weeks ago, the ‘white metal’ was the undisputed king of commodities, effortlessly shattering that $100 mark in the process and peaking at a not bad $121 per ounce. Now though, all that seems like a lifetime ago, as traders find themselves trying to make sense of a whole tangled mess of geopolitical ‘curveballs’ and hawkish central bank posturing.
The Geopolitical Trap: Why Ceasefire Talks Crushed the Rally
Silver’s recent 40% dive from its January highs was in large part triggered by a pretty sudden shift in the Iran conflict narrative. What started out as a classic ‘escalate and panic’ scenario had everyone scrambling for cover when reports emerged of a U.S.-led 15 point ceasefire proposal. This whole ‘peace premium’ exit happened just as the US Dollar Index (DXY) was going nuts, touching record highs near 100.00.
The trouble is that this created a bit of a nightmare scenario for silver – the ‘safe haven’ bid just about disappeared at the same time as the stronger dollar made the metal more expensive for those buying it from overseas.
And to rub salt in the wound, that conflict-driven oil spike to $110 per barrel has only served to cement the fear of stagflation, prompting the Federal Reserve to basically say that rate cuts are completely off the cards for 2026. And in an environment where 5% bond yields aren’t exactly a rare thing, non-yielding silver is having an awful lot of trouble getting back on its feet.
Silver (XAG/USD) Technical Analysis: Trapped in a Bearish Descent
The H4 chart for XAG/USD is nothing if not ominous. Despite the recent bounce, the price action is characterized by a “lower-high” pattern that suggests the path of least resistance is still tilted to the downside.
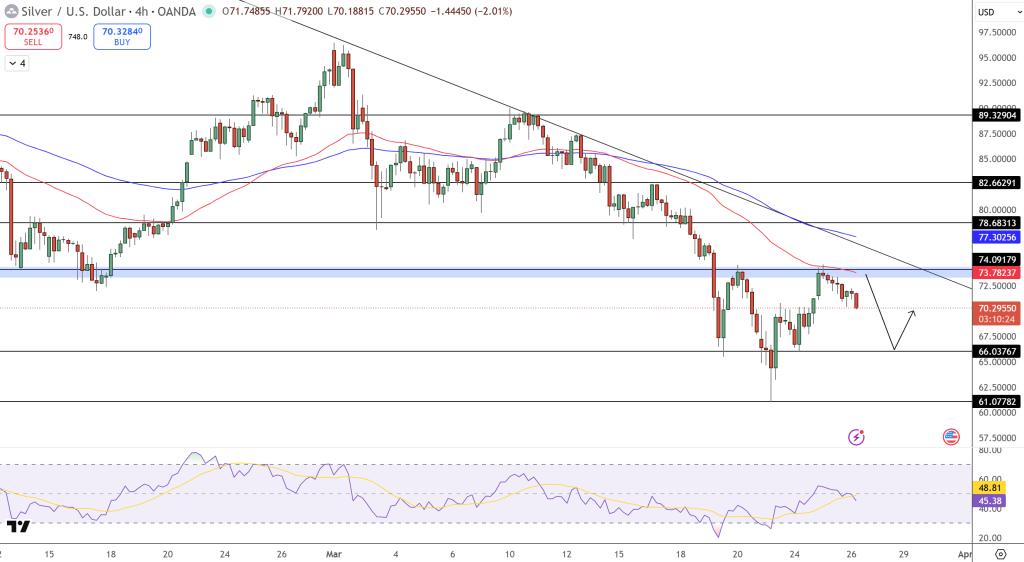
- Resistance at $74.00: That’s still the immediate cap on prices. Break through and hold above it & you might be okay, but if you can’t, then you can bet your bottom dollar fresh bears will pile on.
- Where does the Support Kick in?: The $70.00 level has been a test horse three times already this year and it’s kept on holding – up until now anyway. A daily close below it and its right back to that 200-day EMA of $62.00 – and maybe even those October 2025 highs of $55.00 to worry about.
- Momentum Indicators Just Aren’t Convinced: The RSI is at about a 50/50 split – not exactly flying high. And you’ve moved out of that “panic” zone, but all the same, there just isn’t a lot of volume to suggest a real reversal is around the corner.
The 2026 Wildcard: A Structural Deficit Persists
Despite all the technical doom & gloom, the long term implications for silver are actually pretty rosy still. In fact, this is now the sixth year running that supply just cant keep up with demand. And now we’re seeing those industrial buyers like solar, EV and AI guys picking up the tab for over half the silver market – creating a kind of “safety net” that just didn’t exist in previous cycles.
Some people still reckon 2026 will be a real wild ride. A lot of these big banks are forecasting an average of $81 is where we’ll be but then some of the more optimistic ones like Bank of America reckon maybe if the gold/silver ratio gets really tight & people get a bit desperate we could see a price as high as $135 – and all this on the back of one of the biggest deficits on record. But at the end of the day, silver is still a bit of a gamble – super high reward if you play it right, or super high risk if you get it wrong & end up on the wrong side of a $70 drop.
- Check out our free forex signals
- Follow the top economic events on FX Leaders economic calendar
- Trade better, discover more Forex Trading Strategies
- Open a FREE Trading Account
- Read our latest reviews on: Avatrade, Exness, HFM and XM
Related Articles
Sidebar rates
Related Posts
