Ethereum Teeters at $2,000 as Macro Fears and Weak Demand Collide
As a combination of macro headwinds and sector-specific weakness pummeled cryptocurrency markets on Friday, Ethereum is currently trading
Quick overview
- Ethereum is currently trading around $2,000, down 3.5% due to macroeconomic headwinds and sector-specific weaknesses.
- The selloff was exacerbated by the liquidation of $104 million in leveraged long positions and a broader risk aversion in the cryptocurrency market.
- Ethereum faces structural challenges, including declining demand and regulatory pressures, with significant net outflows from US-listed spot Ether ETFs.
- Short-term predictions suggest bearish trends, while medium-term outlooks remain cautiously constructive if certain price levels are reclaimed.
As a combination of macro headwinds and sector-specific weakness pummeled cryptocurrency markets on Friday, Ethereum ETH/USD is currently trading at about $2,000, down about 3.5% in the last day. The main cause of the selloff was not unique to ETH: Iranian state media’s denial of a U.S. peace plan halted diplomatic progress, driving oil prices beyond $93 per barrel and causing a flight from riskier assets in both stocks and cryptocurrencies. Ethereum took the brunt of that fear trade since it is a high-beta asset.
The fallout happened quickly. The fall was exacerbated by the liquidation of almost $104 million in leveraged Ethereum long positions in less than a day. It was confirmed that this was a widespread rotation out of risk rather than an implosion particular to Ethereum as major cryptocurrencies like Solana SOL/USD and BNB BNB/USD plummeted 3–5% simultaneously. Sidelined capital has nowhere to hide because there was no sector rotation into other digital assets.
Three Structural Headwinds Blocking a Sustained Recovery
Ethereum was battling a declining demand picture on several fronts even prior to the global shock.
Since March 18, US-listed spot Ether ETFs have seen $298 million in net outflows—six days in a row of redemptions—indicating cautious institutional views that a 2.8% native staking yield hasn’t done much to change this. As a result of a significant decline in on-chain application activity, weekly decentralized exchange volumes on Ethereum presently average $9.4 billion, which is around 50% less than the levels observed in the last quarter of 2025. The annualized premium for ETH two-month futures is around 2%, which is significantly less than the 4–8% range that usually indicates strong bullish demand. Bears on ETH have no reason to give up until that premium reappears.
Additional pressure is coming from regulatory obstacles. A recent FATF report called for tighter oversight of peer-to-peer stablecoin transactions, and the US Senate is looking into a possible ban on yield for stablecoins held on exchanges. These developments are dampening enthusiasm for cryptocurrencies in a market that had hoped the Trump administration would provide a more accommodating policy environment.
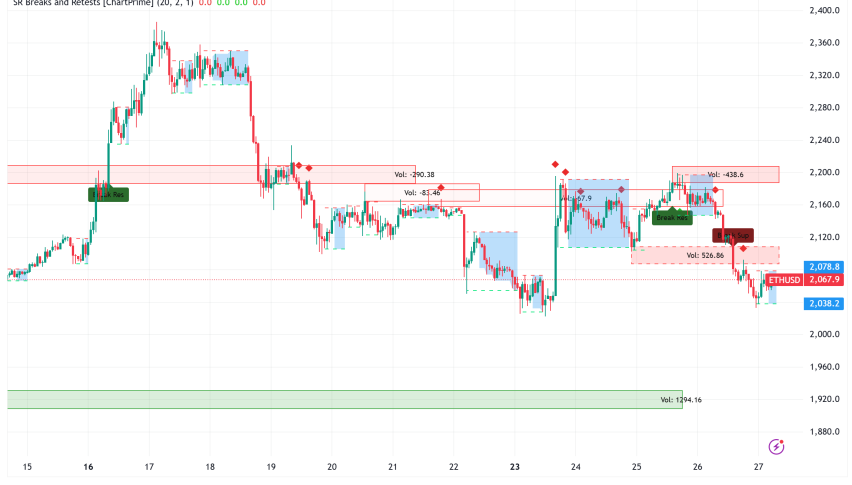
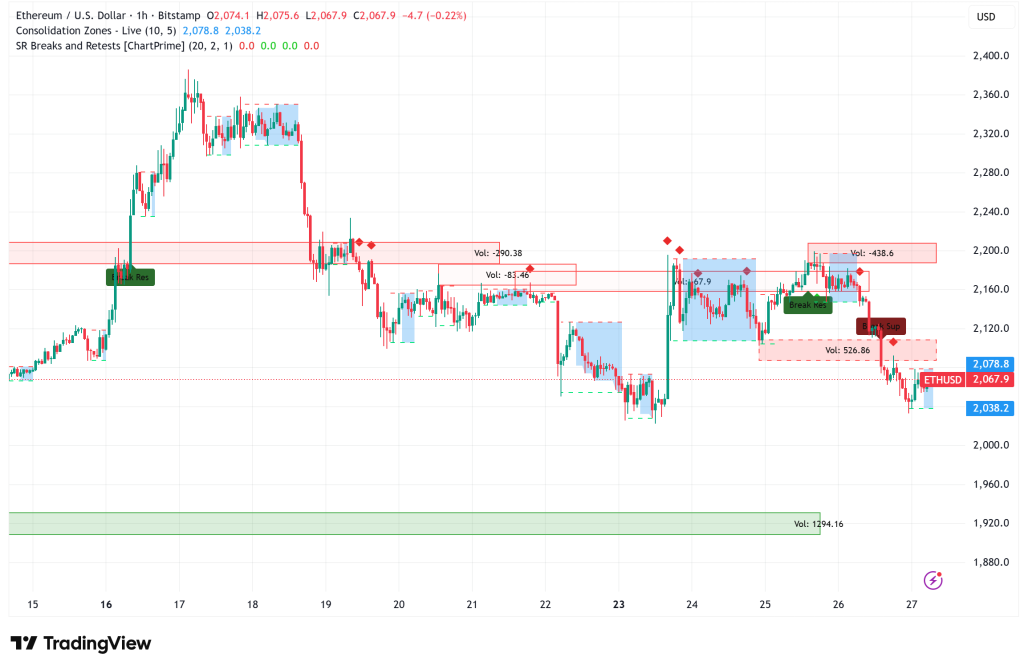
ETH/USD Technical Analysis: $2,050 Support Is the Line in the Sand
Technically speaking, Ethereum has fallen below the $2,100 support level, raising immediate concerns about the $2,050 zone. A confirmed closing over $2,050 might lead to a consolidation phase and stabilize price activity. However, a break below might lead to a retest of the next important support level at $1,939, which hasn’t been seen since early 2025.
Below the $2,160–$2,180 neckline, the overall trend is still negative. Before any significant comeback toward the $2,400 target is credible, that zone must be decisively reclaimed. Technical expert Trader Tardigrade has spotted a possible cup-and-handle formation on ETH’s daily chart, but both the 50-day exponential moving average and important Fibonacci resistance levels must be cleared for a breakout to be confirmed.
The PCE inflation report on Friday is the event that will move the market the fastest. A lower-than-anticipated figure would allay worries about Fed tightening and improve risk perception, which might provide ETH with the macrotailwind it needs to hold the $2,050 floor.
Supply Squeeze Builds a Longer-Term Bull Case
Not every signal is directed downward. Ethereum’s supply dynamics are subtly tightening beneath the short-term noise. Due to record monthly withdrawals—roughly 31.6 million ETH left key platforms in February alone—exchange holdings have dropped to their lowest point since 2016. The reserves of Binance are at their lowest point since 2020. At the same time, a record-breaking 38 million ETH, or almost 33% of the total supply, are locked in staking. An additional layer of structural demand is added by corporate accumulation by companies like BitMine, SharpLink, and The Ether Machine.
Infrastructure provider for staking Everstake contends that over the medium run, a structurally stronger price floor is being created by this diminishing liquid supply in conjunction with persistent demand. But for the time being, the patient owns that thesis.
Ethereum Price Prediction: Bearish Near-Term, Cautiously Constructive Beyond Q2
- Short-term (0–72 hours): Bearish. ETH is likely to test $2,050 on the PCE release. A hot inflation print risks a drop toward $1,939. A soft reading may stabilise price around current levels.
- Medium-term (4–8 weeks): Neutral to cautiously bullish, contingent on ETF flow reversal and a DEX volume recovery. Reclaiming $2,180 is the minimum requirement for a credible rally setup.
- Bull case: A confirmed cup-and-handle breakout above $2,400 if institutional flows return and geopolitical tensions ease.
- Bear case: Sustained macro fear and continued on-chain weakness drive ETH toward the $1,800–$1,900 range.
- Check out our free forex signals
- Follow the top economic events on FX Leaders economic calendar
- Trade better, discover more Forex Trading Strategies
- Open a FREE Trading Account
- Read our latest reviews on: Avatrade, Exness, HFM and XM
Related Articles
Sidebar rates
Related Posts
