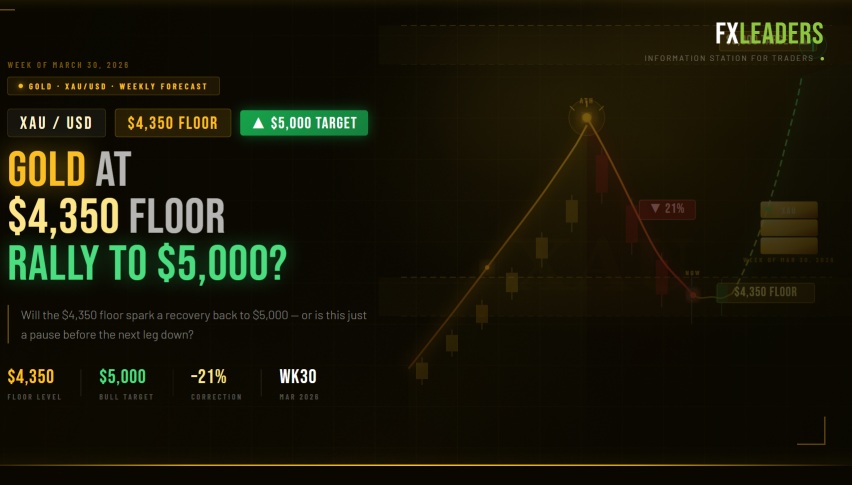
Gold Price Forecast – Week of March 30, 2026: Will the $4,350 Floor Spark a Rally Back to $5,000?
Gold trades at $4,490 after a 15% correction from March highs. Full technical analysis of the $4,114 confluence support, RSI oversold signal
Quick overview
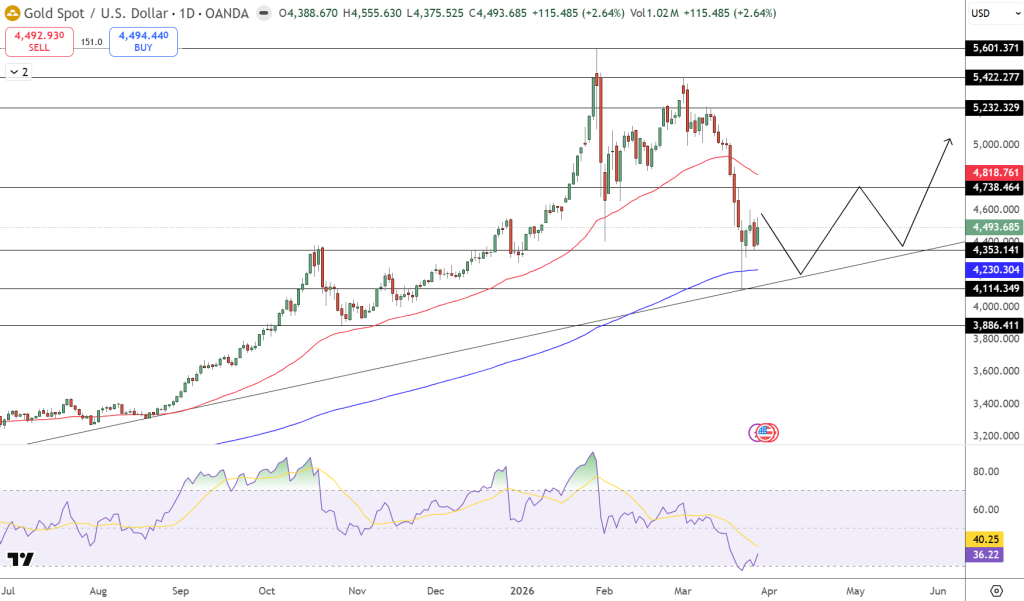
- Gold (XAU/USD) is currently trading between $4,490 and $4,500 after a significant drop of nearly 15% from early March highs near $5,200.
- The recent decline in gold prices is attributed to a hawkish Fed stance, a stronger US Dollar, and inflation concerns from rising energy prices.
- Key support levels for gold are between $4,350 and $4,353, with critical attention on the $4,114 to $4,230 confluence zone for potential bullish signals.
- Despite the recent downturn, major institutions like JP Morgan and Deutsche Bank maintain long-term price targets for gold above $6,000 per ounce.
Live GOLD Chart

Gold (XAU/USD) is trading between $4,490 and $4,500 as March 2026 ends, bouncing back slightly after dropping almost 15% from early-month highs near $5,200. With the RSI close to oversold and a busy week ahead, the coming days may shape gold’s direction for the next quarter.
Why Gold Has Corrected 15% From Its March Highs
The reasons behind gold’s recent drop are clear. Three related macro factors have put pressure on the metal simultaneously.
-
First, the Fed has taken a more hawkish stance. CME FedWatch now shows no rate cuts expected for 2026, compared to three at the start of the year. Because gold does not pay interest, higher real Treasury yields make holding gold less attractive.
-
Second, the US Dollar has jumped as investors seek safety during the Iran conflict, which puts extra pressure on gold prices.
-
Third, last week saw gold’s worst weekly drop since March 2020, as major central banks turned more hawkish due to concerns about inflation from rising energy prices.
Despite these challenges, recent daily charts show long lower wicks near $4,353, which means buyers are stepping in to support prices. This is a positive technical sign.
Gold Technical Analysis: The $4,114 Confluence Zone and the Path Back to $5,000
The daily chart suggests the market is trying to find a bottom.
GOLD fell below its 50-day moving average at $4,818, which sped up the decline. Still, the $4,350 to $4,353 support level has held up, with long lower wicks showing that buyers are stepping in. The 200-day simple moving average, near $4,406, is now the main area where buyers and sellers are competing.
For bullish investors, $4,114 is the key level to watch. This is where the long-term upward trendline meets the 100-day moving average at $4,230. If prices fall below this zone, it would signal a deeper correction and could challenge the overall bullish outlook.
On the upside, if gold moves back above $4,738, it would be the first sign that the trend is recovering. If that happens, the important $5,000 level and resistance at $5,232 could become targets again. With the RSI at 36 and moving up from oversold levels, it looks like the worst of the selling may be over.
Trade idea (bullish): Consider buying if there is a clear bullish signal in the $4,350 to $4,114 support area. Place a stop below $4,050. Look for targets at $4,738 and then $5,000.
The Week’s Macro Calendar: Powell, NFP, and the Fed’s Next Signal
Four main events will influence gold prices this week:
- Monday, March 30: Fed Chair Powell speaks. If he suggests interest rates will stay high for longer, the dollar could strengthen and gold may fall. If his comments are more dovish, gold could see a quick rebound.
- Wednesday, April 1: ADP Payrolls and ISM Manufacturing PMI reports come out. These will give an early look at the health of the job market before the week’s main event.
- Friday, April 3 (Good Friday): US Nonfarm Payrolls report. This is the most important event of the week. If the report is weak and shows the economy is slowing, gold could rally toward $4,738. If the report is strong, gold may fall and test support near $4,114.
Why JP Morgan and Deutsche Bank Still Target $6,000+
Even after a 15% drop, big institutions remain confident. JP Morgan and Deutsche Bank still have long-term price targets above $6,000 per ounce. Their view is based on two main ideas: central banks are steadily moving away from the dollar, and gold is seen as a safe haven during unexpected geopolitical crises. This argument has become even stronger since the Strait of Hormuz crisis started.
Most analysts expect gold to end 2026 between $5,155 and $5,515. With gold now at $4,490, there could be significant upside if the broader economic picture changes.
FAQ: Gold Price – Correction, NFP Impact, and $5,000 Outlook
Why is gold falling in March 2026?
Zero Fed rate cuts are priced for 2026, real Treasury yields have risen sharply, and a stronger US dollar creates mechanical downward pressure on dollar-denominated gold. The energy-shock-driven hawkish pivot by major central banks has been gold’s worst enemy this month.
What is the key support level for gold right now?
$4,350–$4,353 is the immediate support being defended. Below that, the critical confluence zone sits at $4,114–$4,230, where the long-term ascending trendline meets the 100-day moving average. A sustained break below $4,114 would be a structurally significant technical event.
How does NFP data affect gold prices?
A weak Nonfarm Payrolls print raises recession concerns, pulls Treasury yields lower, and weakens the dollar — all bullish for gold. A strong NFP reinforces the Fed’s “higher for longer” stance, pushing real yields up and the dollar higher, which is bearish for bullion. This Friday’s report is the single most important near-term catalyst for XAU/USD.
- Check out our free forex signals
- Follow the top economic events on FX Leaders economic calendar
- Trade better, discover more Forex Trading Strategies
- Open a FREE Trading Account
- Read our latest reviews on: Avatrade, Exness, HFM and XM
Related Articles


Sidebar rates
Related Posts
