Bitcoin Reclaims $72,000 as Macro Fears Fuel Appetite for Digital Scarcity
As a result of a confluence of macroeconomic forces that have paradoxically pushed investors toward limited financial assets, Bitcoin (BTC)
Quick overview
- Bitcoin is currently holding above $72,000, showing a 1.6% increase amid macroeconomic pressures and recession anxiety.
- The weakening US dollar and institutional ETF inflows have contributed to Bitcoin's rise, surpassing the $70,000 resistance level.
- Geopolitical tensions, particularly regarding Iran, pose risks to Bitcoin's rally, with potential for a drop below $68,000 if ceasefire conditions deteriorate.
- Technical analysis suggests a near-term trading range of $68,000 to $75,000, with Bitcoin potentially reaching $75,500 by mid-May, though downside risks remain.
As a result of a confluence of macroeconomic forces that have paradoxically pushed investors toward limited financial assets, Bitcoin BTC/USD is holding above $72,000 on Friday, April 10, posting a 1.6% increase over the previous 24 hours. After weeks of erratic price movement that saw Bitcoin fall as low as the $60,000–$65,000 region earlier in the quarter, the rise restores a psychologically significant level.
The Rally: Recession Anxiety Becomes Bitcoin’s Unlikely Ally
Worsening US economic data is the catalyst, which is quite unusual. According to the Bureau of Economic Analysis, the fourth-quarter GDP was revised drastically downward to an annualized rate of just 0.5%, while the core Personal Consumption Expenditures (PCE) index increased 0.4% month over month in February. Sticky inflation combined with slow growth is the traditional definition of stagflation, and it has undermined trust in the Federal Reserve’s capacity to provide a smooth landing.
However, this data has made the US dollar weaker in relation to a basket of foreign currencies rather than causing a sell-off. With its fixed number of 21 million coins, Bitcoin is increasingly seen as a benefactor of the historical tendency for a weaker dollar to boost rare assets. This bullish trend has been strengthened by institutional ETF inflows and a wider rebound in the cryptocurrency sector, which has enabled BTC to surpass the $70,000 resistance level.
Geopolitical Overhang: The Iran Ceasefire Wildcard
There are risks associated with the rally. Following accusations by senior Iranian officials, including parliamentary speaker Mohammad Bagher Ghalibaf, that Israel’s ongoing operations in Lebanon, drone incursions into Iranian airspace, and denial of uranium enrichment violate the precarious ceasefire mediated by US President Donald Trump on Wednesday, crude oil prices surged back toward $97 per barrel.
For cryptocurrency markets, the geopolitical stakes are very high. The announcement of the truce caused WTI crude to drop below $100 and S&P 500 futures to soar to 30-day highs, demonstrating the classic inverse link between oil prices and riskier assets. Traders worry that Bitcoin might quickly drop below $68,000 if the truce completely breaks down. As of right moment, war-and-peace stories seem to have a greater influence on Bitcoin’s performance than the underlying US macro statistics.
BTC/USD Technical Analysis: Key Levels to Watch
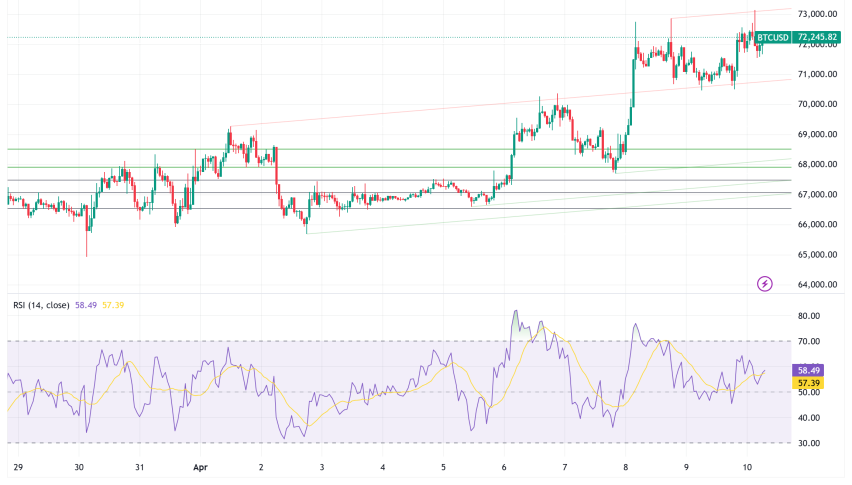
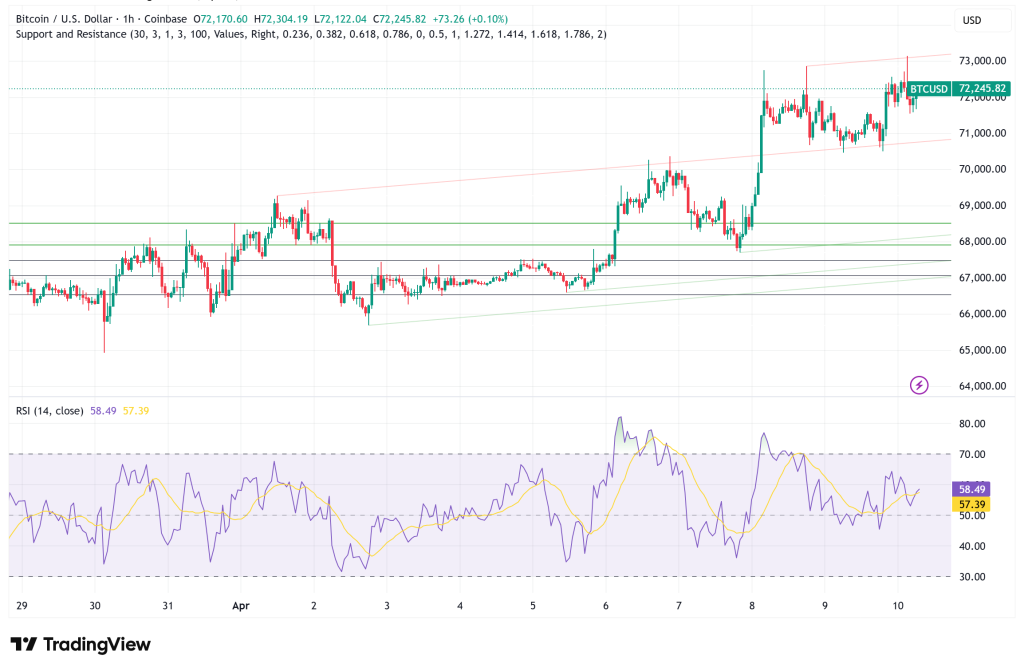
Technically speaking, Bitcoin is not yet firmly positive, but it is cautiously constructive. The daily chart’s most important pivot point is located at $69,860, with resistance at $74,625 and support at $63,265. OneUp Trader Failure to hold $68,000 could lead to a retest of the larger $60,000–$65,000 support zone, but a clean closing above $74,625 would be a significant technical breakout.
The short-term forecast for Bitcoin is bullish, with 10 indications indicating buying conditions, 6 bearish, and 7 neutral, according to a composite of 23 technical signals that include oscillators, moving averages, and trend indicators. The market is looking for its next directional cue as the Relative Strength Index (RSI) is lingering close to the neutral 49–50 zone, indicating neither overbought nor oversold conditions.
According to technical analysis, there is significant resistance between $74,000 and $75,000. Some models estimate that there is a 65% chance that Bitcoin will reach $75,000 in April.
On-Chain Warning: The Cycle Bottom Indicator Has Not Yet Triggered
On-chain data may be the most frightening source of information for bulls. Every significant cycle bottom has historically been highlighted by the peak of the long-term holder (LTH) supply in loss metric, which measures the percentage of Bitcoin held for more than 155 days that is currently underwater. 53% of LTH supply was lost during the 2015 bottom, 45% in 2018, and roughly 44% during the 2022 bear market trough.
LTH supply in loss is currently at about 29% and is increasing. Although this indicates worsening conditions, it is still much below the 44%–53% level that has traditionally indicated a true cycle floor. In other words, according to this historically accurate metric, Bitcoin may be approaching a bottom but has not yet done so. This neutral-to-cautious market stance is supported by the CMC Crypto Fear and Greed Index, which is now at 47.
Bitcoin Price Prediction: Near-Term Range With Upside Potential Into May
The near-term trading range for Bitcoin seems to be roughly $68,000–$75,000, with $72,000–$73,000 acting as the gravitational center given the technical setup and macro backdrop. In the upcoming weeks, Bitcoin may reach $74,600–$75,500 due to a prolonged truce and ongoing dollar decline. According to algorithmic estimates, Bitcoin might increase by about 5.7% from current values to over $75,500 by mid-May 2026.
There are still potential downside risks, such as a collapse in the Iran negotiations, a reversal of the dollar’s decline, or a wider sell-off in the equity market, which may push Bitcoin back near the $63,000–$65,000 support range. The best way to describe this market is as a recovery-in-progress rather than a certified bull restart until the long-term holder loss indicator gets close to the 44%+ barrier.
- Check out our free forex signals
- Follow the top economic events on FX Leaders economic calendar
- Trade better, discover more Forex Trading Strategies
- Open a FREE Trading Account
- Read our latest reviews on: Avatrade, Exness, HFM and XM
Related Articles
Sidebar rates
Related Posts
