Bitcoin Drops to $70,600 as Oil Surges 9.5% After US Announces Strait of Hormuz Blockade
Bitcoin went tumbling to $70,623 on April 13 2026. Global oil prices shot up more than 9.5% - all thanks to the escalating...
Quick overview
- Bitcoin dropped to $70,623 on April 13, 2026, amid escalating global tensions and failed US-Iran diplomatic talks.
- Global oil prices surged over 9.5%, with Brent crude exceeding $100 a barrel due to fears of supply disruptions.
- The market is experiencing a risk-off sentiment, leading to declines in Bitcoin and stock futures while safe-haven assets rise.
- Despite recent volatility, Bitcoin has gained approximately 7.4% since late February, indicating medium-term resilience.
Bitcoin went tumbling to $70,623 on April 13 2026. Global oil prices shot up more than 9.5% – all thanks to the escalating global tensions. Diplomatic talks between the US & Iran had collapsed over the weekend, prompting a very sharp risk off sell of across the markets.
At the moment that we write this , Bitcoin is hovering around $70,700 to $71,000 – a drop of around 1.9% – and as low as $70,623 at one point. Brent crude spiked above $100 a barrel within minutes of the session kicking off – reflecting the fear that the blockage of the key chokepoint could cause supply disruption and send shockwaves through the global energy market – given it handles a fifth of global oil flows.
Why the Markets Are Freaking Out
- Blocked in Stalemate: High-level talks between the US & Iran in Islamabad failed to make any progress , and suddenly President Trump ordered the ports and coastal areas in Iran to be blockaded. While non-Iranian vessels are probably still being allowed to transit the strait, it’s raising all sorts of concerns over shipping delays, insurance costs & potential energy supply shocks.
- Risk Off Panic: The escalation set off a classic risk off move. Bitcoin and stock futures are getting hammered , while oil and safe-haven assets are shooting up. Volatility indexes are climbing everywhere – in commodities and digital assets.
- Inflation Jitters Are Back: The oil price spike is adding to inflation pressures that have already been creeping into recent CPI data. Now markets are getting spooked by a renewed fear of sticky energy-driven inflation that could complicate the Fed’s job – and really weigh on growth expectations.
Bitcoin’s Short-Term Tilt
Despite the pull back, Bitcoin has still gained around 7.4% since late Feb when the conflict really hit. Now this suggests that it’s still looking pretty resilient medium-term – even when the short-term volatility spikes.
However it’s still hanging out with risk assets during those sudden liquidity shocks – and that’s causing Bitcoin to get hammered alongside equities when uncertainty starts rising.
Bitcoin (BTC/USD) Technical Analysis
On the 4H chart Bitcoin has just broken down below its ascending channel – so it’s signaling a shift from looking pretty bullish to being a bit corrective. Now it’s testing that $70,600 support zone which is the Fib + a horizontal level after that nice rejection of $73,800-$74,000 resistance at the 1.272 Fib.
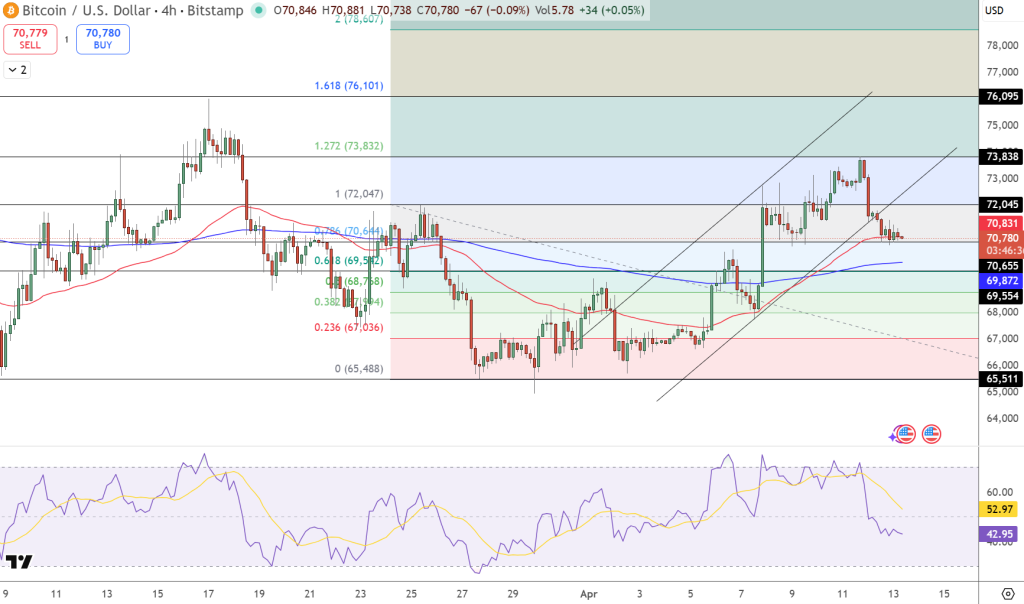
The 200 EMA at $69,800 is the next key dynamic support. RSI is down at 40-45 – showing that the previous bullish momentum is starting to fade – but is also approaching oversold territory.
Key Levels:
- Resistance: $72,000 → $73,800 → $76,100
- Support: $70,600 → $69,800 → $68,700
Forecast: Bearish below $72,000 – aiming for $69,800 and $68,700 … while a very strong reclaim above $72,000 would turn the sentiment back to looking quite bullish again and could open up the possibility of a retest of $73,800.
- Check out our free forex signals
- Follow the top economic events on FX Leaders economic calendar
- Trade better, discover more Forex Trading Strategies
- Open a FREE Trading Account
- Read our latest reviews on: Avatrade, Exness, HFM and XM
Related Articles
Sidebar rates
Related Posts
