USD/CAD Jumps off the 20 Daily SMA after Canadian Data Disappoints Badly
Earlier on I was looking at the daily USD/CAD chart. This pair has been in an uptrend during most of September after losing many cents for
Earlier on I was looking at the daily USD/CAD chart. This pair has been in an uptrend during most of September after losing many cents for many months. Although, during October this forex pair has traded sideways in a 150 pip range.
So, when I was looking at this pair earlier today, the price was sitting right at the 20 SMA (grey). That moving average has provided support this month, aided by the 50 SMA (yellow), as you can see on the daily chart below.
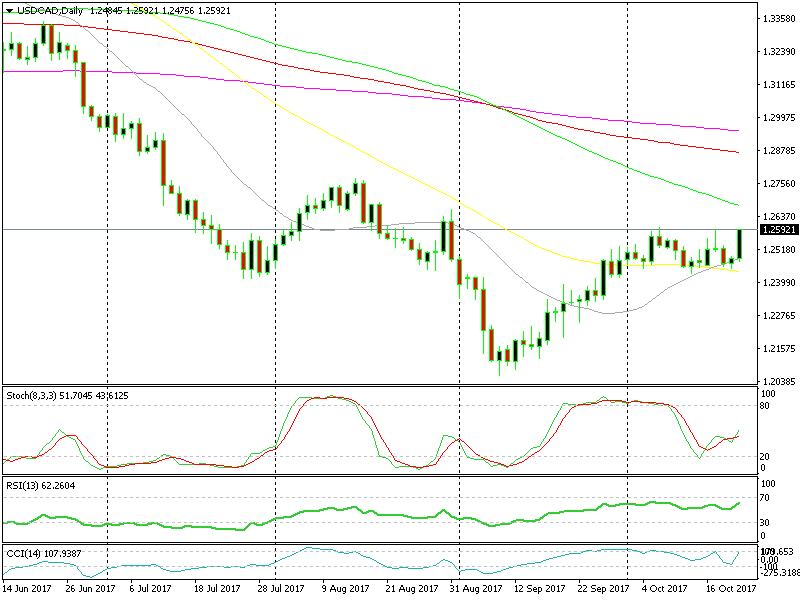 The two moving averages provided solid support today
The technical indicator such as stochastic and RSI were also heading higher, but the economic figures from Canada were scheduled for today, so we stayed out. You never know how the data will be, so it’s dangerous trading the numbers before they’re released.
You remember the trade in Gold last Friday, which we opened before the US inflation report was released. It closed in profit, but it gave us a scare when it jumped above the $1,300 level.
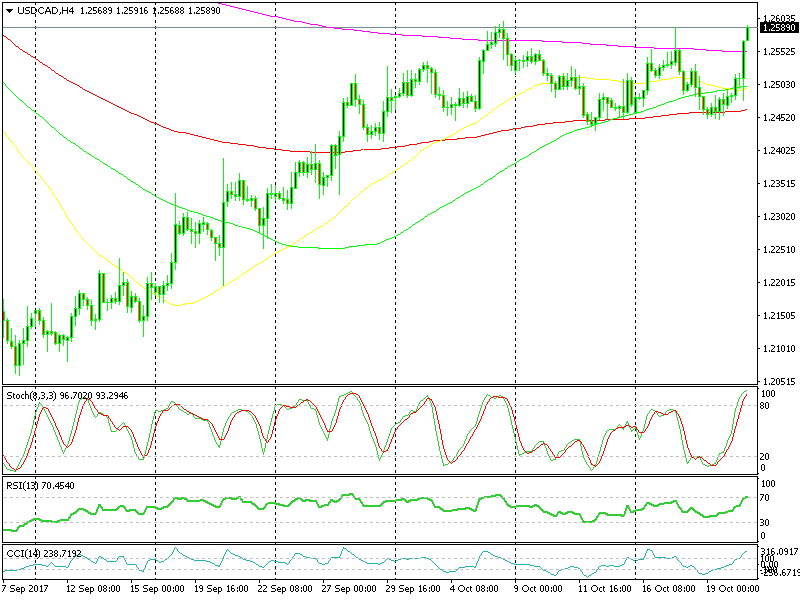 The 200 SMA has finally been broken
Anyway, USD/CAD has jumped more than 100 pips now and we are looking for a buying spot. The 200 SMA (purple) on the H4 chart looks like a good place to go long since it used to be resistance before. Now that it is broken, it is possible that it might turn into support
- Check out our free forex signals
- Follow the top economic events on FX Leaders economic calendar
- Trade better, discover more Forex Trading Strategies
- Open a FREE Trading Account
- Read our latest reviews on: Avatrade, Exness, HFM and XM
Related Articles


Sidebar rates
Related Posts
