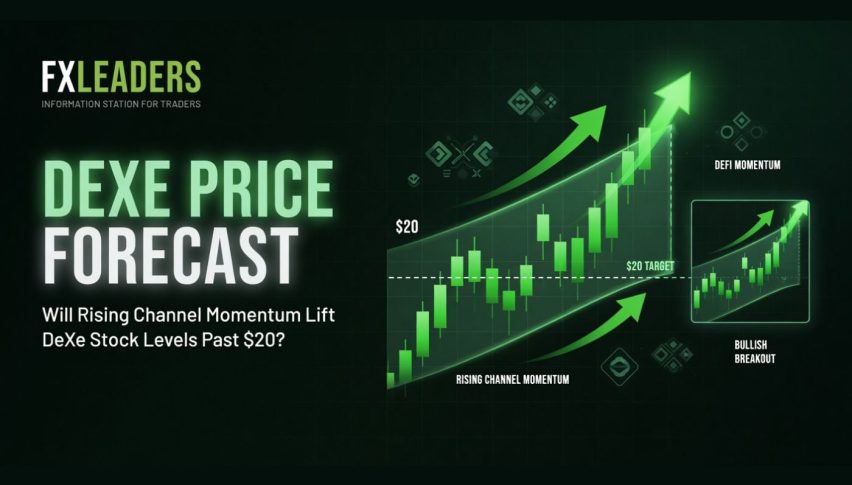
Litecoin LTC, Fantom FTM Face Major Support at $100 and $1 Respectively
Litecoin LTC and Fantom FTM are deciding whether to break below important support levels or reverse higher

Cryptocurrencies were showing uncertainty for a couple of months after the decline which lasted from November until January. In March, the sentiment improved and cryptos made some decent gains, which seems like a trend reversal, although the price reversed back down. Litecoin and Fantom have given back all the gains and are now facing some major support zones at $100 and $1 respectively, so let’s see if they will break below.
Fantom Daily Chart – The 50 SMA Turned into Resistance For FTM

The range is getting narrower for FTM
While other cryptocurrencies were in the middle of a strong pullback, Fantom was displaying strength until the middle of January after it headed for the all-time highs below $3.50, but failed to make new record highs. But the sentiment turned bearish eventually, as the Wonderland controversy weighed on the DeFi cryptocurrencies such as FTM. Later, the departure of senior staff at Fantom weighed further on this token. Anton Nell who is a senior solutions architect and Andre Cronje, a prolific developer left Fantom, which weighed on this cryptocurrency, sending it down to $1.04.
Last month we saw a strong bounce which took FTM/USD to $1.70. Although the price reversed down again and it is trading just above $1 now. That’s a big support level and below that, we have the other support zone around $0.90. We are thinking about buying FTM around here but we will follow the sentiment in the crypto market to see when it turns around, because now it is still quite bearish. Last week, the Terra-backed 4pool went live on Fantom network, attracting $31M in TVL within ours, but it isn’t helping the price much.
Litecoin Daily Chart Analysis – MAs Pushing LTC Down

LTC keeps returning too many times to the support zone
Litecoin has been on a steady decline since surging higher in November last year, almost reaching $300. There have been a few attempts to turn bullish but they have all failed and LTC keeps making lower highs, which is a strong bearish sign, suggesting that sellers are jumping in faster every time.
The support zone around $100 has been holding many times since January, but LTC keeps returning to this level, which suggests that it might be broken soon. About a week ago, transactions worth more than $100k were noticing spikes as they crossed their “normal” threshold and peaked at the highest level they’ve been at in over a year. Although that didn’t bring any spike in the price so LTC remains bearish. We are thinking about buying LTC around here, if the support level holds but we will follow the price action to see.
Litecoin LTC Live Chart
- Check out our free forex signals
- Follow the top economic events on FX Leaders economic calendar
- Trade better, discover more Forex Trading Strategies
- Open a FREE Trading Account
- Read our latest reviews on: Avatrade, Exness, HFM and XM
Related Articles
Sidebar rates
Related Posts
