Prices Forecast: Technical Analysis
For today, the predicted closing price for USD/INR is 96.27, with a range of 96.26 to 96.28. Looking ahead to the week, the forecasted closing price is 96.30, with a range of 96.25 to 96.35. The technical indicators suggest a stable outlook, with the RSI at 58.557 indicating a bullish trend, while the ATR of 0.7623 suggests moderate volatility. The price has been hovering around the pivot point of 96.27, indicating a balance between buyers and sellers. The support levels at 96.26 and resistance at 96.28 provide clear boundaries for price movement. Given the current market sentiment and technical indicators, a slight upward movement is expected. The overall trend appears to be bullish, supported by the recent price action. Investors should watch for any significant news that could impact these predictions.
Fundamental Overview and Analysis
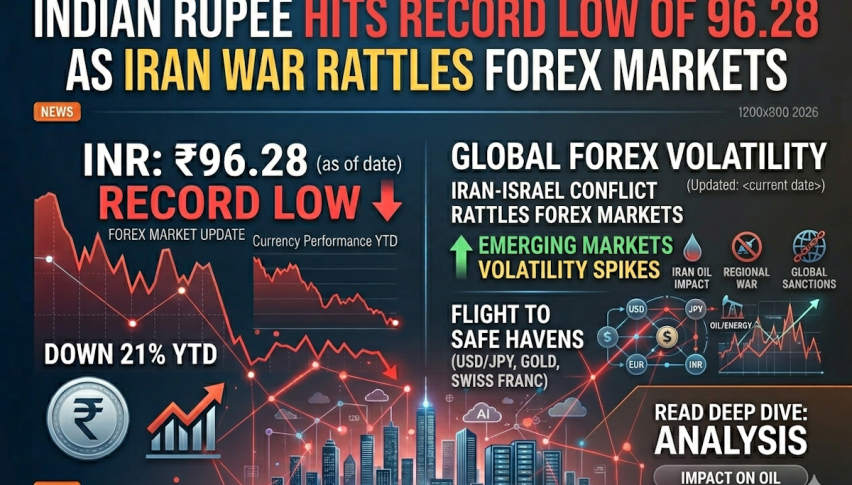
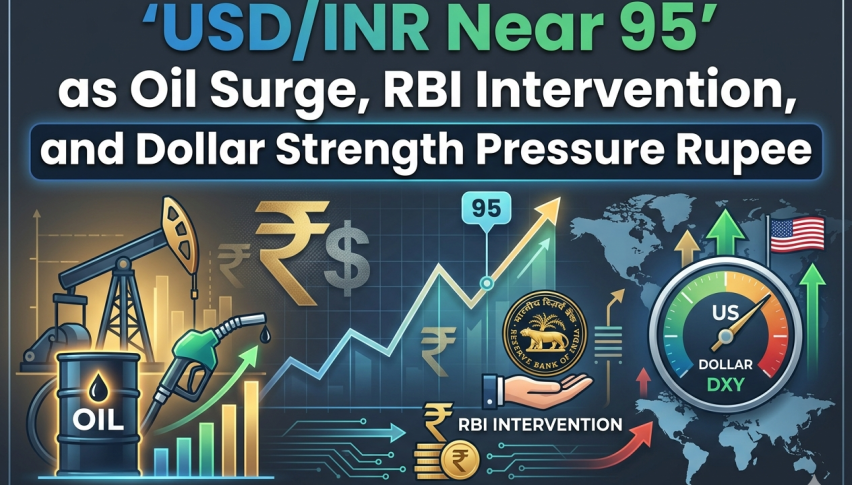
The USD/INR has shown a consistent upward trend recently, reflecting a stronger dollar against the Indian rupee. Factors influencing this trend include the U.S. Federal Reserve’s monetary policy and India’s economic performance. Investor sentiment remains cautiously optimistic, with many viewing the USD as a safe haven amid global uncertainties. Opportunities for growth exist as the Indian economy continues to recover, but challenges such as inflation and geopolitical tensions could pose risks. Currently, the asset appears fairly valued, with no significant overvaluation or undervaluation detected. Market participants are closely monitoring economic indicators that could sway the USD/INR exchange rate.
Outlook for USD/INR
The future outlook for USD/INR remains cautiously optimistic, with potential for gradual appreciation in the short term. Current market trends indicate a stable demand for the dollar, supported by economic recovery in the U.S. Over the next 1 to 6 months, we could see the USD/INR trading within a range of 96.25 to 96.50, depending on macroeconomic factors. Long-term forecasts suggest a potential rise towards 97.00 as the Indian economy stabilizes and grows. However, external factors such as global market volatility and changes in U.S. monetary policy could significantly impact this outlook. Investors should remain vigilant about geopolitical developments that could affect currency stability.
Technical Analysis
Current Price Overview: The current price of USD/INR is 96.27, which is unchanged from the previous close. Over the last 24 hours, the price has shown stability with minor fluctuations, indicating low volatility. Support and Resistance Levels: The support levels are at 96.26, 96.26, and 96.25, while resistance levels are at 96.28, 96.28, and 96.29. The asset is currently trading at the pivot point of 96.27, suggesting a neutral market sentiment. Technical Indicators Analysis: The RSI is at 58.557, indicating a bullish trend. The ATR of 0.7623 suggests moderate volatility, while the ADX at 23.5315 indicates a strengthening trend. The 50-day SMA and 200-day EMA are converging, suggesting potential bullish momentum. Market Sentiment & Outlook: Sentiment is currently bullish, supported by price action above the pivot point and a rising RSI. The ADX indicates a strengthening trend, while the ATR suggests manageable volatility.
Forecasting Returns: $1,000 Across Market Conditions
The table below outlines potential investment scenarios for USD/INR, providing insights into expected returns based on different market conditions.
| Scenario | Price Change | Value After 1 Month |
|---|---|---|
| Bullish Breakout | +1% to ~$97.00 | ~$1,010 |
| Sideways Range | 0% to ~$96.27 | ~$1,000 |
| Bearish Dip | -1% to ~$95.50 | ~$990 |
FAQs
What are the predicted price forecasts for the asset?
The predicted daily closing price for USD/INR is 96.27, with a weekly forecast of 96.30. The price is expected to range between 96.26 and 96.28 today.
What are the key support and resistance levels for the asset?
Key support levels are at 96.26 and 96.25, while resistance levels are at 96.28 and 96.29. The pivot point is at 96.27, indicating a neutral market sentiment.
What are the main factors influencing the asset’s price?
Factors influencing USD/INR include U.S. monetary policy, India’s economic performance, and global market conditions. Investor sentiment and geopolitical developments also play a significant role.
What is the outlook for the asset in the next 1 to 6 months?
The outlook for USD/INR is cautiously optimistic, with potential trading between 96.25 and 96.50. Long-term forecasts suggest a rise towards 97.00, depending on economic stability.
What are the risks and challenges facing the asset?
Risks include inflation, geopolitical tensions, and global market volatility. These factors could impact the stability and growth of USD/INR in the future.
Disclaimer
In conclusion, while the analysis provides a structured outlook on the asset’s potential price movements, it is essential to remember that financial markets are inherently unpredictable. Conducting thorough research and staying informed about market trends and economic indicators is crucial for making informed investment decisions.