BNB Price History
Binance Coin price started off at $0.11 against the USD in 2017, with trading volumes of around $250,000. It then gained upward momentum to trade at $21, with trading volumes of about $389.23 million at the beginning of 2018. However, BNB/USD could not sustain the bull run, and it tumbled to $8 in April of 2018, with trading volumes reduced to $49 million. The crypto then remained subdued, below $30, until May 2019, when the trading volumes surged to $457 million, and the token seemed to gain some bullish momentum to the upside. BNB/USD then plunged again, to a low of $10, and trading volumes of $681 million by March.
According to our Binance Coin price prediction, the coin gained renewed upward momentum at the beginning of 2021, which saw it surging from a low of $50 to $284, as it turned in more than 400% gains in just two weeks. It then retraced to $190 as of February 22, before embarking on another rally. The bullish momentum that followed took the pair from a low of $211, at the beginning of March 2021, to an all-time high of above $690 as of May 10 – a gain of over 200% in just two months. However, the price was destined to crash from the ATH, plummeting to around $259 as of May 17, and wiping out over 150% in gains in the process.
2022 was rough. Terra collapsed. A few more blockchain companies fell into bankruptcy. Came to the FTX contagion that saw all cryptocurrency prices follow a downward trend. BNB closed around $250.
Today in 2023, the Binance Coin trades around a range of $230 – $347. In this article, we want to look at some of the factors influencing the price of Binance Coin, and how they will influence the coin’s general trend in 2023 and beyond.
Recent Price Changes
Binance Coin began the fourth quarter of 2021 on a bullish note. The pair moved from $415 at the start of October, surging to trade at $474 in just two weeks, and gaining 14%, but the bullish sentiment was still not over. Another notable surge in BNB/USD took the price from $445 on October 28 to $661, and it began trading slightly under the previous high, with gains of around 50%. Between November 10 and December, BNB/USD has remained range-bound, between $510 and around $650. At the time of writing, the pair was trading at $588, after a bearish crypto market sentiment set in.
Recent Changes in the Binance Coin Price:
| Period | Change ($) | Change (%) |
| 1 Week | -58.45 | -9.31 |
| 1 Month | -86.27 | -13.16 |
| 3 Months | +152 | +36.53 |
| 6 Months | +152 | +69.10 |
| 1 Year | +540.69 | +1,893 |
BNB Live Chart
Binance Price Prediction
| Binance Forecast: 2023 Price: $500 – $800 |
Binance Forecast: 2 Years Price $1,000 – $2,000 |
Binance Forecast: 3 Years $3,000+ |
According to strong use cases and a history of strong upside moves, BNB/USD will be bullish in the next three years. We expect the pair to close at $2,000 by the end of next year, supported by our technical and fundamental analysis. We also expect Binance Coin to jump to $3,000 in the next two years, and in the next three years, we could see the price go above that mark, with continued adoption. The predictions are speculative, based on previous price trails, and BNB/USD could even make higher jumps.
Introduction to Binance Coin
BNB is Binance’s native currency; it is an ERC20 token that runs on the Ethereum blockchain. 166,801,148 BNB tokens are circulating out of a capped maximum supply of 200 million tokens. 50% of the tokens are allocated to the platform’s ICO, 40% to the founders, and the remaining 10% was divided among angel investors. BNB coin was introduced by the Binance platform in 2017. The platform has a repurchasing plan to buy back BNB tokens and destroy some each quarter, using 20% of its profits. Its target is to burn 100 million of the remaining BNB. Binance supports trading pairs, like BTC, LTC, ETH, NEO and BNB. The coin ranks as the third-largest cryptocurrency, with a market capitalization of $92 billion.
Besides this, Binance has grown to be a decentralized blockchain network, and the leading crypto exchange in the world. The exchange can handle 1.4 million orders per second, making it one of the fastest cryptocurrency exchanges in the market. The centralized exchange also fulfills the highest transaction volumes per day, at $29 billion ahead of Coinbase Exchange, which handles about $6 billion transactions in 24 hours. The founders of Binance include CEO Changpeng Zhao and He Yi, who is the chief marketing officer.
Factors Affecting the Price of Binance
Supply of Binance Coins
The supply of BNB tokens affects the price, as an increased demand drives the price upward. There is a fixed supply of Binance coins, and the network has been destroying tokens to curb inflation. We expect to see a surge in the future, as the number of tokens is reduced.
The Growth of the Ecosystem
Binance began as a cryptocurrency exchange platform, but it has continued to diversify its services in the cryptocurrency space. The platform has expanded its range of crypto derivative instruments on offer. Binance also provides numerous ways for investors to enter the futures markets. These include the USD Margined Futures Contracts, Coin Margin Futures contracts, Binance Leveraged Tokens and Binance Options. Binance has also attracted investors through its initial coin offerings. As the platform’s ecosystem continues to grow, there will be more buyers, resulting in a further surge of the Binance coin.
Binance Smart Chain
Binance Smart Chain is a blockchain platform that was developed by Binance. The Chain uses the Proof of Stake Authority (PoSA) to allow the development of decentralized applications and the launch of smart contracts. The platform features low transaction speeds of about 3 seconds block time and affordable prices. As BSC gains popularity, so will the demand for Binance Coins, which power the platform.
Factors that could hinder Adoption
Regulations
The crypto industry is facing a tough regulatory terrain. China cracked down on all the privately operated cryptocurrency and mining activities. The probe has affected the adoption of crypto assets in this highly populated country. Although the US has taken a more lenient approach in regulating the sector, like the launch of the Bitcoin futures ETF, there is still a long way to go. If the regulators continue to impose tougher regulations on the cryptocurrency sector, Binance Coin could be affected.
Competition
Many global cryptocurrency exchanges compete directly with Binance. Coinbase, Huobi Global, and Kucoin are some of them. BNB also competes against other established cryptocurrencies, such as Bitcoin and Ethereum. More trading activities at the Binance exchange could drive adoption, and the price of BNB would go up accordingly. The Binance Smart Chain competes directly with blockchain networks, like Ethereum and Bitcoin. If BNB remains competitive against other cryptocurrencies, further growth is expected. This, of course, will depend on how much the Binance platform innovates, in order to attract users and retain the existing ones, so that they don’t migrate to rivals.
BNB/USD Technical Analysis
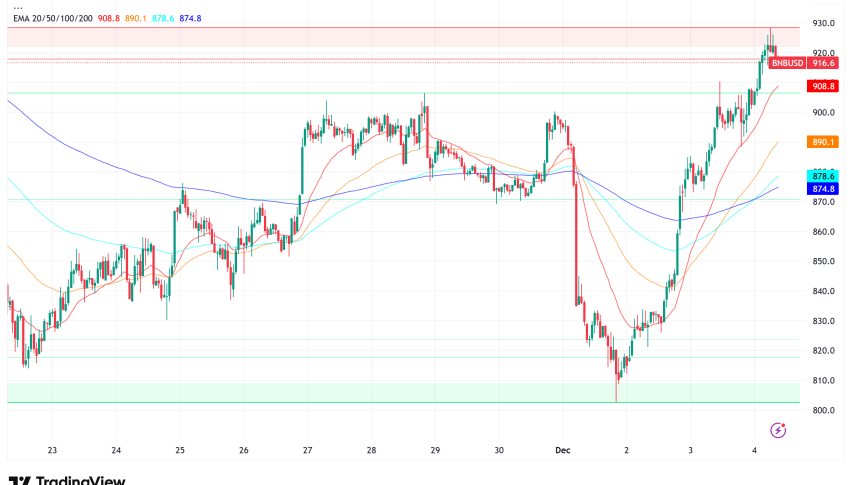
Bullish Momentum Underway on the Daily Chart
The technical outlook for BNB/USD shows that it is on a bullish momentum. Looking at the daily chart, the cryptocurrency is in a clear uptrend, consisting of higher highs and higher lows. BNB/USD is becoming even more interesting, as the cryptocurrency fell by very small margins compared to its peers in a crypto rout over the weekend, which saw Bitcoin touch a low under $45,000. During the same period, BNB fell to a low of around $230, from above 500. At the time of writing, BNB/USD was trading at $330, and looking up on the daily chart. The trading happened after a quick jump from $515, which is now becoming a reference support area, as prices have tested the level several times. A long bullish pin bar can also be seen towering above the support, indicating that BNB/USD is set to go higher.
Besides this, BNB/USD is supported by the 50-moving average (red) and the 100-moving average (yellow). The support by the moving average for the higher timeline suggests that BNB/USD is poised for higher levels in the long term. However, the 20-moving average (blue) is offering resistance to the current price, although this could change quickly if BNB/USD attracts more buyers. The 20 MA could potentially take BNB/USD slightly lower, before a strong surge, or we may see some days of consolidation before prices go higher.
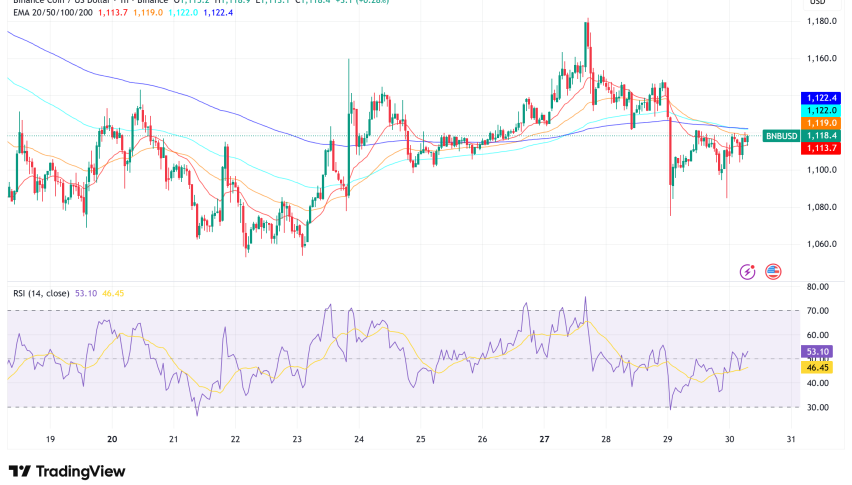
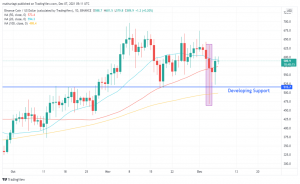
Weekly Chart -BNB/USD Attempts Rebound from a Developing Support
On the weekly chart, BNB/USD is seen rebounding from the developing support at $310. All the moving averages are acting as support, in a bullish momentum that has remained in place since the May crash. In particular, we are keen on the 20-moving average, which rose above the price from June to October, as BNB/USD demonstrated a sluggish bullish momentum. The fact that all the moving averages have joined the support for BNB/USD suggests an upside in the price in the medium and long term, although short-term consolidation could prevail, based on the technical pointers on the daily chart.
Monthly Chart BNB/USD Needs to Clear a Hurdle at $320
On the monthly timeframe, BNB/USD is holding steady at the $300 support, with all the moving averages below it. At the current level, a bullish pin bar is seen forming, but it is not yet complete. Once it is, it could take BNB/USD to higher levels. Nonetheless, the monthly chart shows that the ATH of around $700 is developing as a strong resistance for the cryptocurrency. The price was resisted at that level in early May, before the crash, and subsequently, once again in November. The price is now taking a breather from the ATH. It is trading within a range, while remaining above the $515 to $519 support zone. Therefore, $700 is the most immediate hurdle that BNB/USD needs to clear before we see a strong surge, potentially in the early or first half of next year. Remember, we project $500 as the potential price floor for 2023, as any break above this level could see it turn into support and become a reference point for next year’s prices.