Bitcoin Price Slides: Inflation Worries, Grayscale Selling, and Profit-Taking Cited
Bitcoin (BTC) experienced a sharp drop today, falling below its recent all-time high of $73,700 before recovering to trade above $67,000.

Bitcoin (BTC) experienced a sharp drop today, falling below its recent all-time high of $73,700 before recovering to trade above $67,000. Several factors appear to be contributing to the price volatility.
Potential Causes of the Dip in Bitcoin Price
- Inflation Concerns: Data showing a higher-than-expected producer price index (PPI) sparked fears of the Federal Reserve delaying interest rate cuts, leading some investors to sell riskier assets like Bitcoin.
- Grayscale Selling: Movement of a large amount of Bitcoin by Grayscale to Coinbase, potentially for selling, may have added downward pressure on the price.
- Profit-Taking: After a significant price run-up, some investors may be taking profits, contributing to the short-term sell-off.
Analysts Warn of Potential Pullback in BTC
Analysts like Swissblock and Matrixport had previously cautioned about a potential cooling-off period for Bitcoin after its rapid price increase.
BlackRock’s Bitcoin ETF Sees Record Volume
BlackRock’s iShares Bitcoin Trust (IBIT) saw record trading volume despite the price drop, suggesting continued institutional interest in Bitcoin. However, Grayscale’s Bitcoin Trust (GBTC) remains the largest Bitcoin ETF by assets.
El Salvador Moves Bitcoin Holdings to Cold Wallet
El Salvador’s President revealed that the country has transferred a “big chunk” of its Bitcoin holdings to a cold wallet for secure storage.
Bitcoin Mining Reaches New Difficulty High
Bitcoin mining difficulty reached a new all-time high, indicating increased network activity and competition among miners.
MicroStrategy’s Bitcoin Strategy
MicroStrategy’s aggressive investment strategy using borrowed funds to accumulate Bitcoin highlights the growing institutional interest in the cryptocurrency.
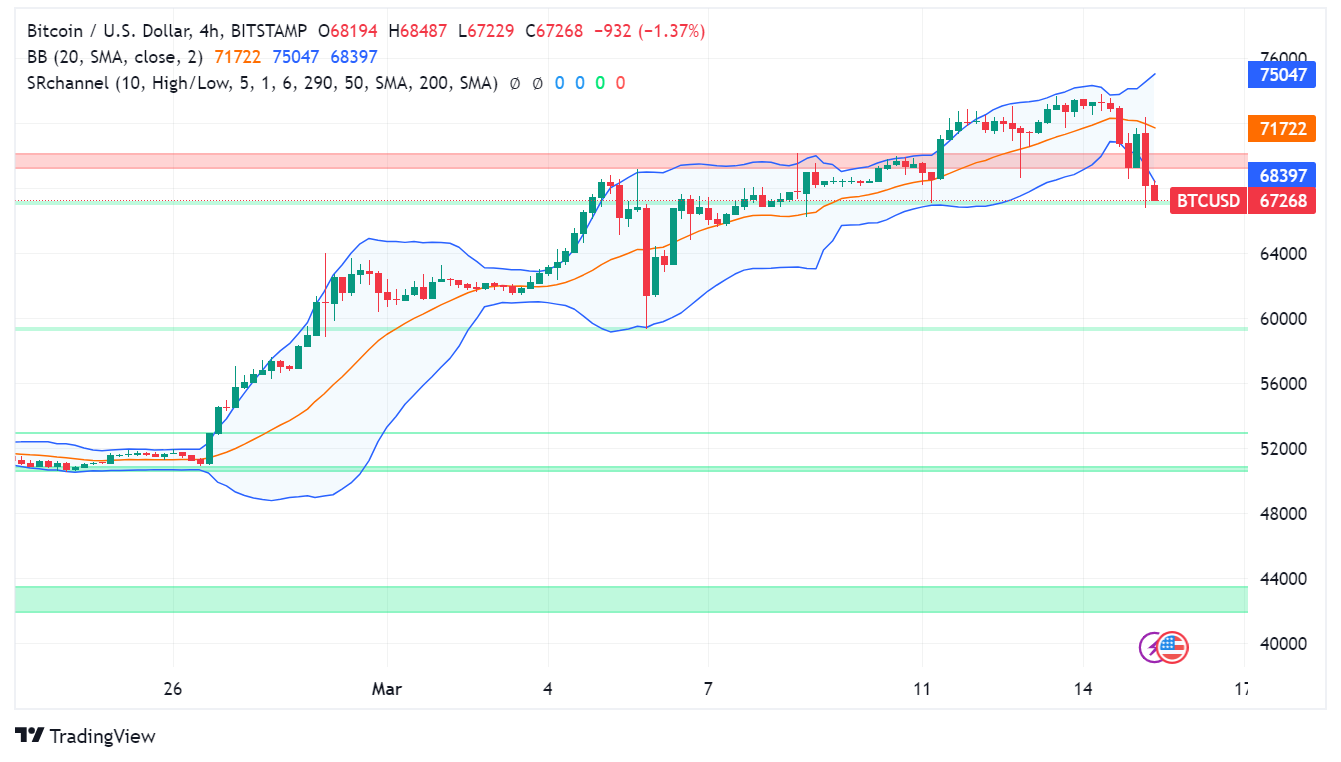
BTC/USD Technical Analysis
- Resistance Levels: The immediate resistance level to watch is $69,000, which could signal a resumption of the uptrend if successfully breached. The previous all-time high of $73,700 remains a significant resistance zone.
- Support Levels: The first major support sits at $67,500. A close below this level could indicate a deeper pullback towards $65,500 or even $65,000.
- Indicators: The Relative Strength Index (RSI) dipped into overbought territory before the price correction, suggesting a potential short-term bounce. However, close monitoring of the RSI is crucial to gauge potential buying or selling pressure.
- Trading Volume: The recent surge in volume indicates increased activity, but whether it translates to sustained buying or selling pressure remains to be seen.
- Check out our free forex signals
- Follow the top economic events on FX Leaders economic calendar
- Trade better, discover more Forex Trading Strategies
- Open a FREE Trading Account
- Read our latest reviews on: Avatrade, Exness, HFM and XM
Related Articles

Sidebar rates
Related Posts
