Dogwifhat Soars: Elon Musk Tweet and St. Patrick’s Day Frenzy Fuel 27% Rally
Dogwifhat (WIF), the red-hot meme coin on the Solana blockchain, is on a tear, surging over 27% in the past 24 hours. This impressive rally


Dogwifhat (WIF), the red-hot meme coin on the Solana blockchain, is on a tear, surging over 27% in the past 24 hours. This impressive rally comes amidst a confluence of factors, including a potential nudge from tech mogul Elon Musk and a surge in meme coin activity on Solana.
Elon’s Tweet Sparks Frenzy Among dogwifhat Traders
The spike in WIF’s price seems to have begun shortly after Elon Musk tweeted an image of his dog sporting a festive St. Patrick’s Day hat. Notably, the image featured a Shiba Inu, the same breed of dog depicted in WIF’s marketing materials, which showcase dogs wearing hats – similar to Musk’s tweet.
While there’s no confirmation of Musk’s intention, the tweet ignited a buying frenzy amongst meme coin enthusiasts, particularly those invested in dog-themed tokens like WIF.
Solana’s Memecoin Mania
This recent surge coincides with a broader upswing in memecoin activity on the Solana network. Data from DeFiLlama reveals that decentralized exchange (DEX) volume on Solana reached a record high of $3.802 billion on Saturday. WIF itself saw a staggering $568 million in trading volume within 24 hours, surpassing even BONK, another popular dog-themed token on Solana.
WIF Outshines Dogecoin and Shiba Inu
It’s worth noting that WIF’s gains significantly outpace those of its more established meme coin rivals, Dogecoin (DOGE) and Shiba Inu (SHIB). At the time of writing, DOGE and SHIB are up a modest 3% and 8% respectively, highlighting WIF’s current momentum.
WIF/USD Technical Analysis
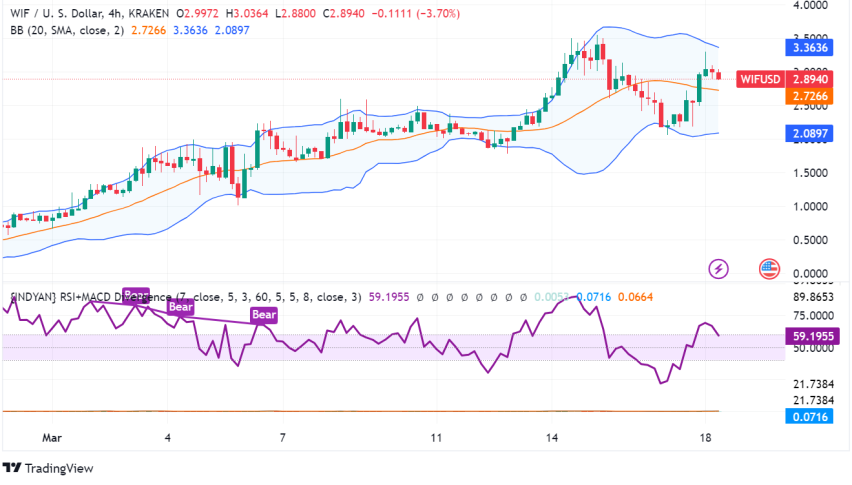
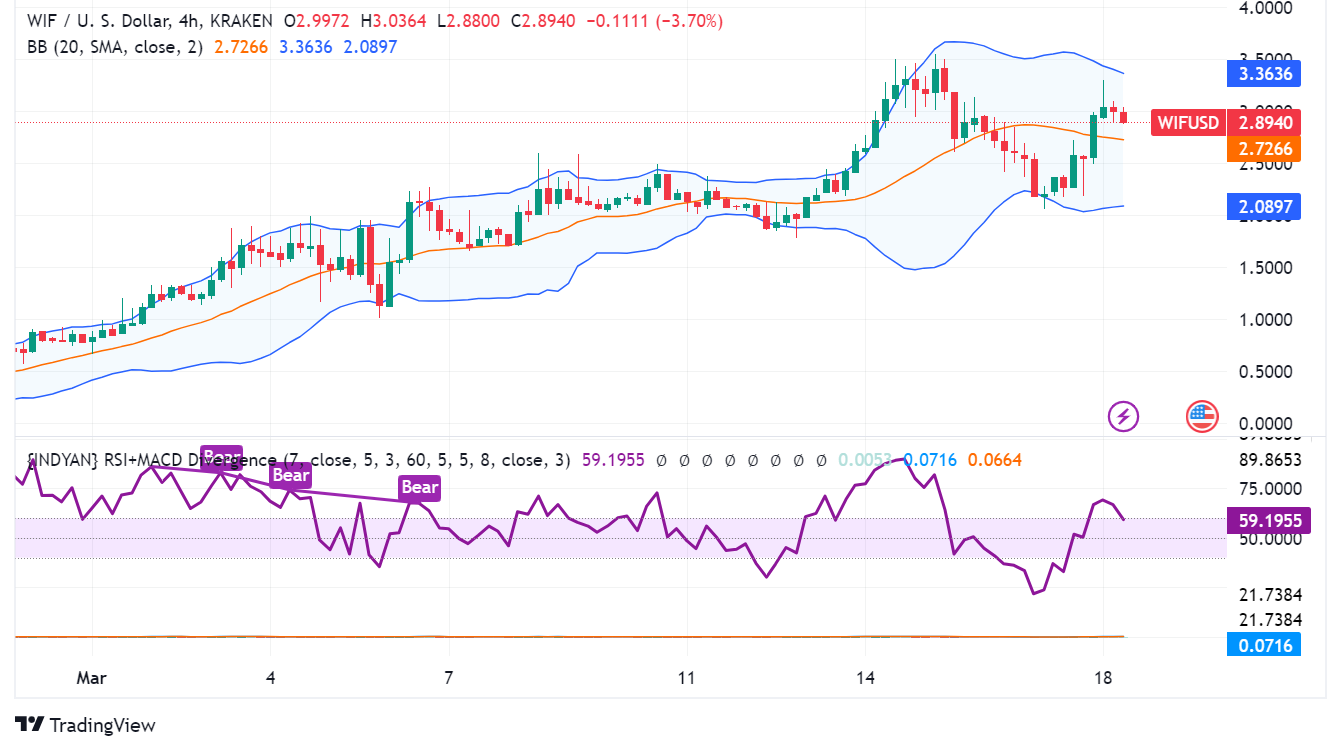
- Recent Price Action: WIF has experienced a bullish breakout, surpassing a resistance level around $3. However, it has since pulled back slightly and is currently trading at $2.89.
- Indicators: The Relative Strength Index (RSI) is currently hovering around 56. A potential pullback could be healthy before another push upwards.
- Moving Averages: The 50-day and 200-day moving averages are both trending upwards, suggesting a long-term bullish trend.
- Support and Resistance: The immediate support level sits around $2.50, which was the previous all-time high before the recent surge. The next resistance level to watch is $3.24, the former all-time high that was breached during the rally.
- Check out our free forex signals
- Follow the top economic events on FX Leaders economic calendar
- Trade better, discover more Forex Trading Strategies
- Open a FREE Trading Account
- Read our latest reviews on: Avatrade, Exness, HFM and XM


