EUR/USD Weekly Forecast: Symmetrical Triangle Pattern Support Near $1.0760; Events Ahead
The EUR/USD pair remains stable, trading at 1.0788, after the U.S. Core Personal Consumption Expenditure (PCE) Price Index
The EUR/USD pair remains stable, trading at 1.0788, after the U.S. Core Personal Consumption Expenditure (PCE) Price Index for February aligned with market forecasts, reinforcing expectations of steady monetary policy. The index reported a month-on-month increase of 0.3% and an annual rise of 2.8%, echoing consensus predictions.
Economic Insights and Currency Impact:
- Core PCE Data: February’s Core PCE at 0.3% MoM and 2.8% YoY, matched market expectations, suggesting a controlled inflationary environment.
- EUR/USD Movements: The currency pair saw minor fluctuations, with levels around 1.0780 to 1.0790, eyeing a significant break above 1.0800.
Upcoming Federal Reserve Communications:
- Speeches by Fed President Mary Daly and Chair Jerome Powell could significantly influence the EUR/USD price, with the market currently assigning a 66% probability to a 25 basis point rate cut in June.
Anticipated Economic Events:
- German GfK Consumer Climate: Expected at -27.4, indicating consumer sentiment.
- Eurozone CPI Data: Spanish and Italian CPI figures will shed light on inflation trends, with Spanish CPI anticipated at 3.2% year-over-year.
- German Unemployment and Retail Sales: Key indicators for Europe’s largest economy, with unemployment change at 4K and retail sales data signaling economic health.
In conclusion, the EUR/USD price forecast remains cautiously stable, with upcoming economic events and Fed communications likely to drive market sentiment and currency valuation.
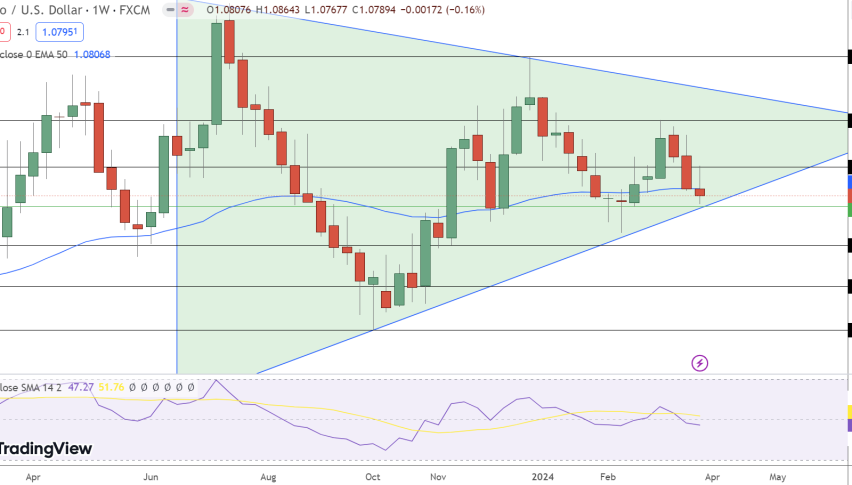
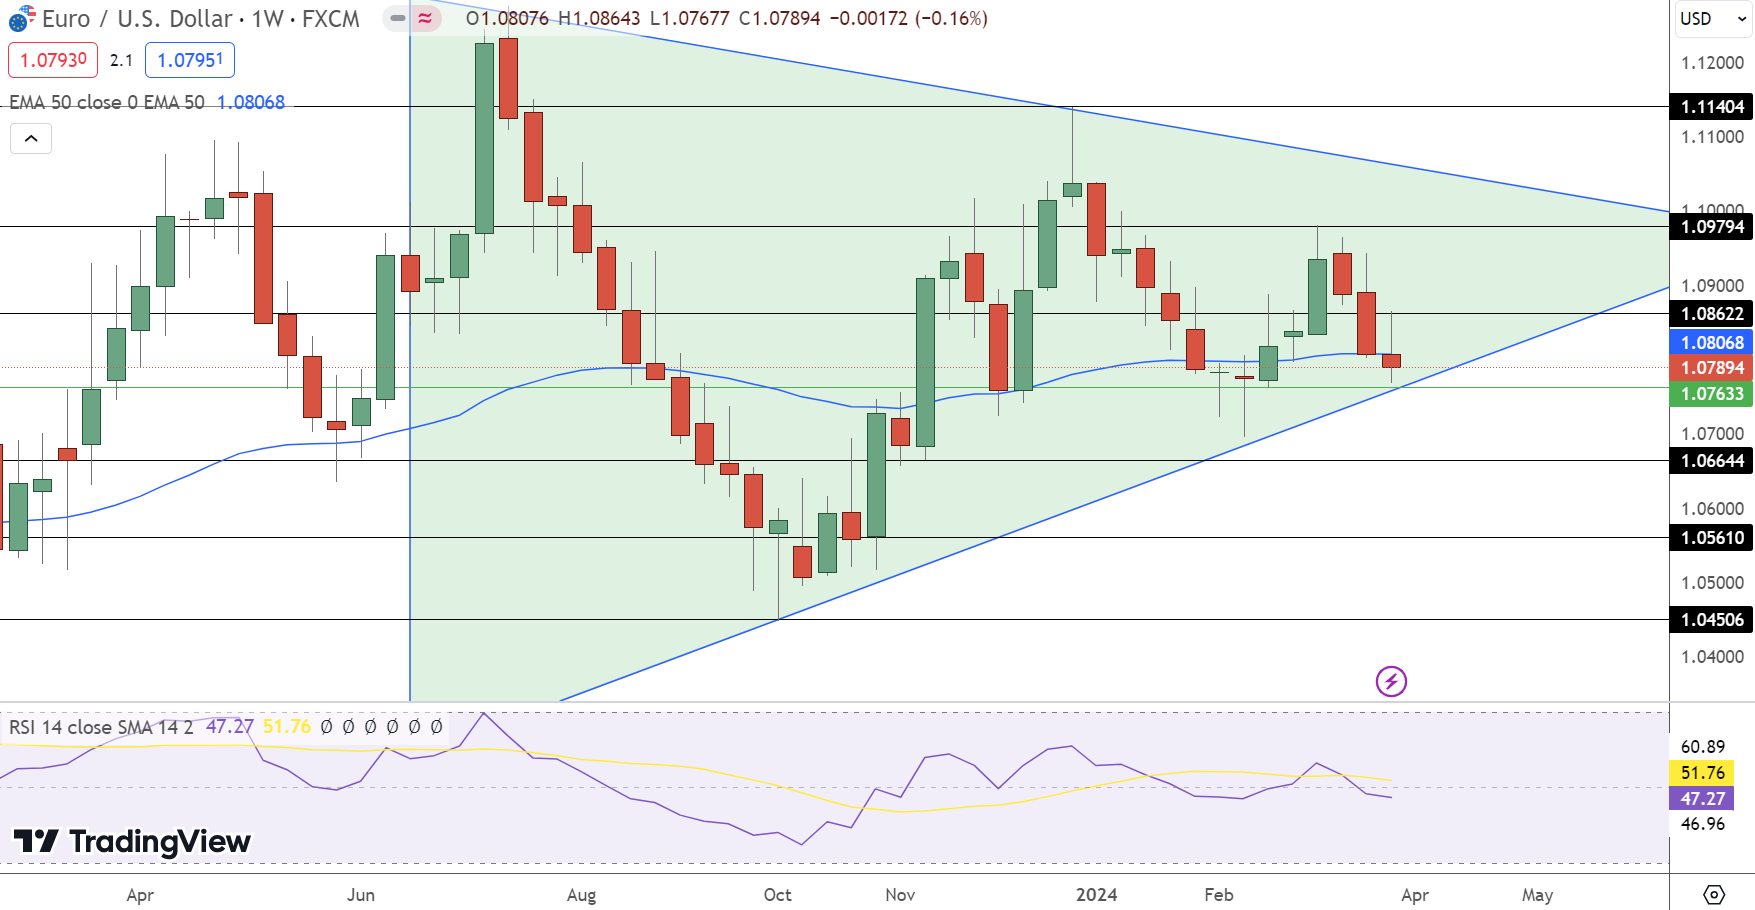
EUR/USD Price Forecast: Weekly Outlook
Analyzing the weekly EUR/USD chart, the currency pair exhibits a hesitance to move definitively, indicating a market in search of direction. The current price hovers near a crucial pivot point delineated by the green line at 1.08068. Resistance levels overhead are mapped at 1.09794, 1.11404, and further up, challenging any bullish momentum. Conversely, support levels lie at 1.06644 and 1.05610, guarding against a bearish slide.
The symmetrical triangle pattern, a hallmark of indecision, hints at a significant breakout on the horizon. A decisive move below the support level at 1.07633 could trigger a descent to lower territories, whereas a climb above the pivot point suggests potential for upside advancement.
The 50 EMA at 1.08068 reinforces the pivot point’s significance, acting as a dynamic level of interest for traders. The Relative Strength Index (RSI) at a neutral 51.76 implies a balance between buying and selling forces.
- Check out our free forex signals
- Follow the top economic events on FX Leaders economic calendar
- Trade better, discover more Forex Trading Strategies
- Open a FREE Trading Account
- Read our latest reviews on: Avatrade, Exness, HFM and XM
Related Articles


Sidebar rates
Related Posts
