Microsoft (MSFT) has rebounded strongly off a key support level at $350, rallying approximately 29% and breaking above resistance at $425.
The breakout suggests a potential target of $544, indicating an upside of around 25% from current levels if momentum continues.
Technical indicators such as the MACD and EMAs are showing bullish signals, reinforcing the medium-term bullish trend.
While the daily chart indicates a developing bullish setup, confirmation is still needed as some short-term indicators show signs of weakening momentum.
Microsoft (MSFT) has decisively rebounded off a key support zone, confirming strong bullish momentum with a clean breakout above resistance. With this technical structure in place, could MSFT be poised for a continued rally of up to 25% from current levels.
Microsoft (MSFT) Stock Breaks Important Fibonacci Resistance
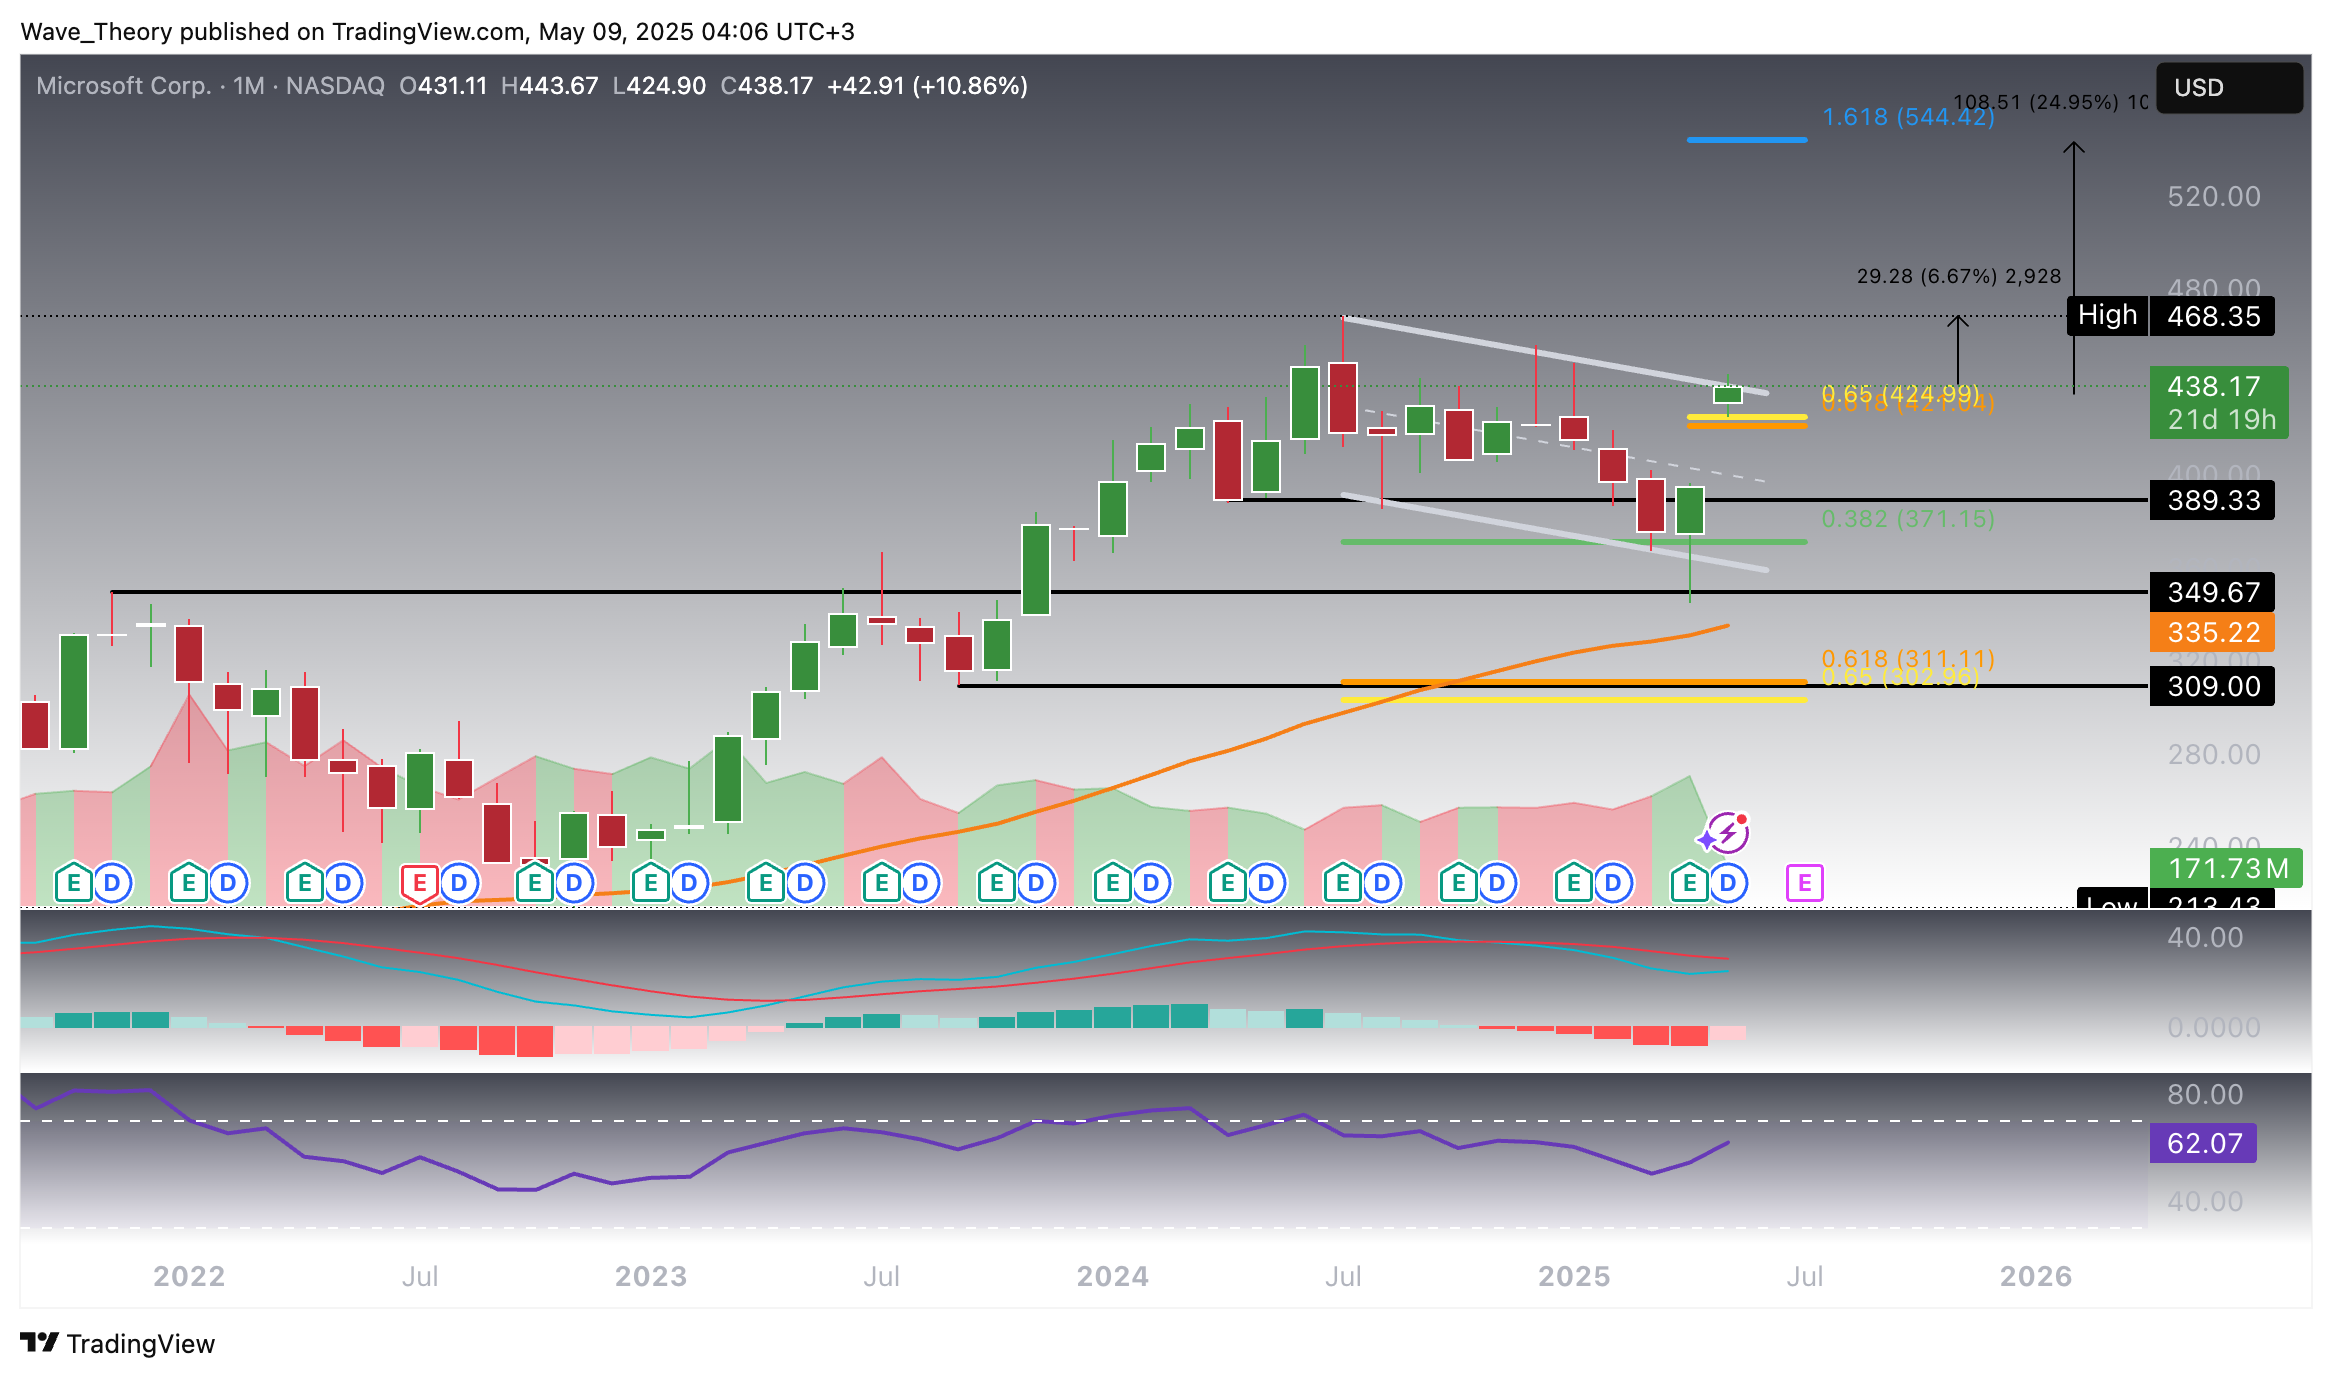
Microsoft (MSFT) has staged a strong recovery, rebounding cleanly off the key support level at $350 and rallying approximately 29% over the past two months. This upward momentum has culminated in a decisive breakout above the golden ratio resistance at $425, suggesting the potential conclusion of the parallel downward channel that has constrained MSFT for much of the past year.
Should this breakout hold, the next major technical target lies at the 1.618 Fibonacci extension, projected near the $544 level. This implies a further upside potential of around 25% from current price levels, supported by both price structure and Fibonacci-based projections.
From a momentum standpoint, the MACD histogram has begun to tick higher on the monthly chart, shifting to a bullish bias after an extended 10-month period of consecutive bearish momentum. This marks a significant shift in trend strength and underlying sentiment. Meanwhile, the RSI remains neutral, providing neither a clear bullish nor bearish divergence, and thereby not contradicting the bullish case.
In summary, MSFT’s breakout above $425—combined with recovering MACD momentum and a clean price structure—opens the door for a measured move toward $544, contingent on sustained strength and confirmation in the coming sessions.
Microsoft
Microsoft (MSFT) Stock: More Bullish Signals By Weekly Indicators
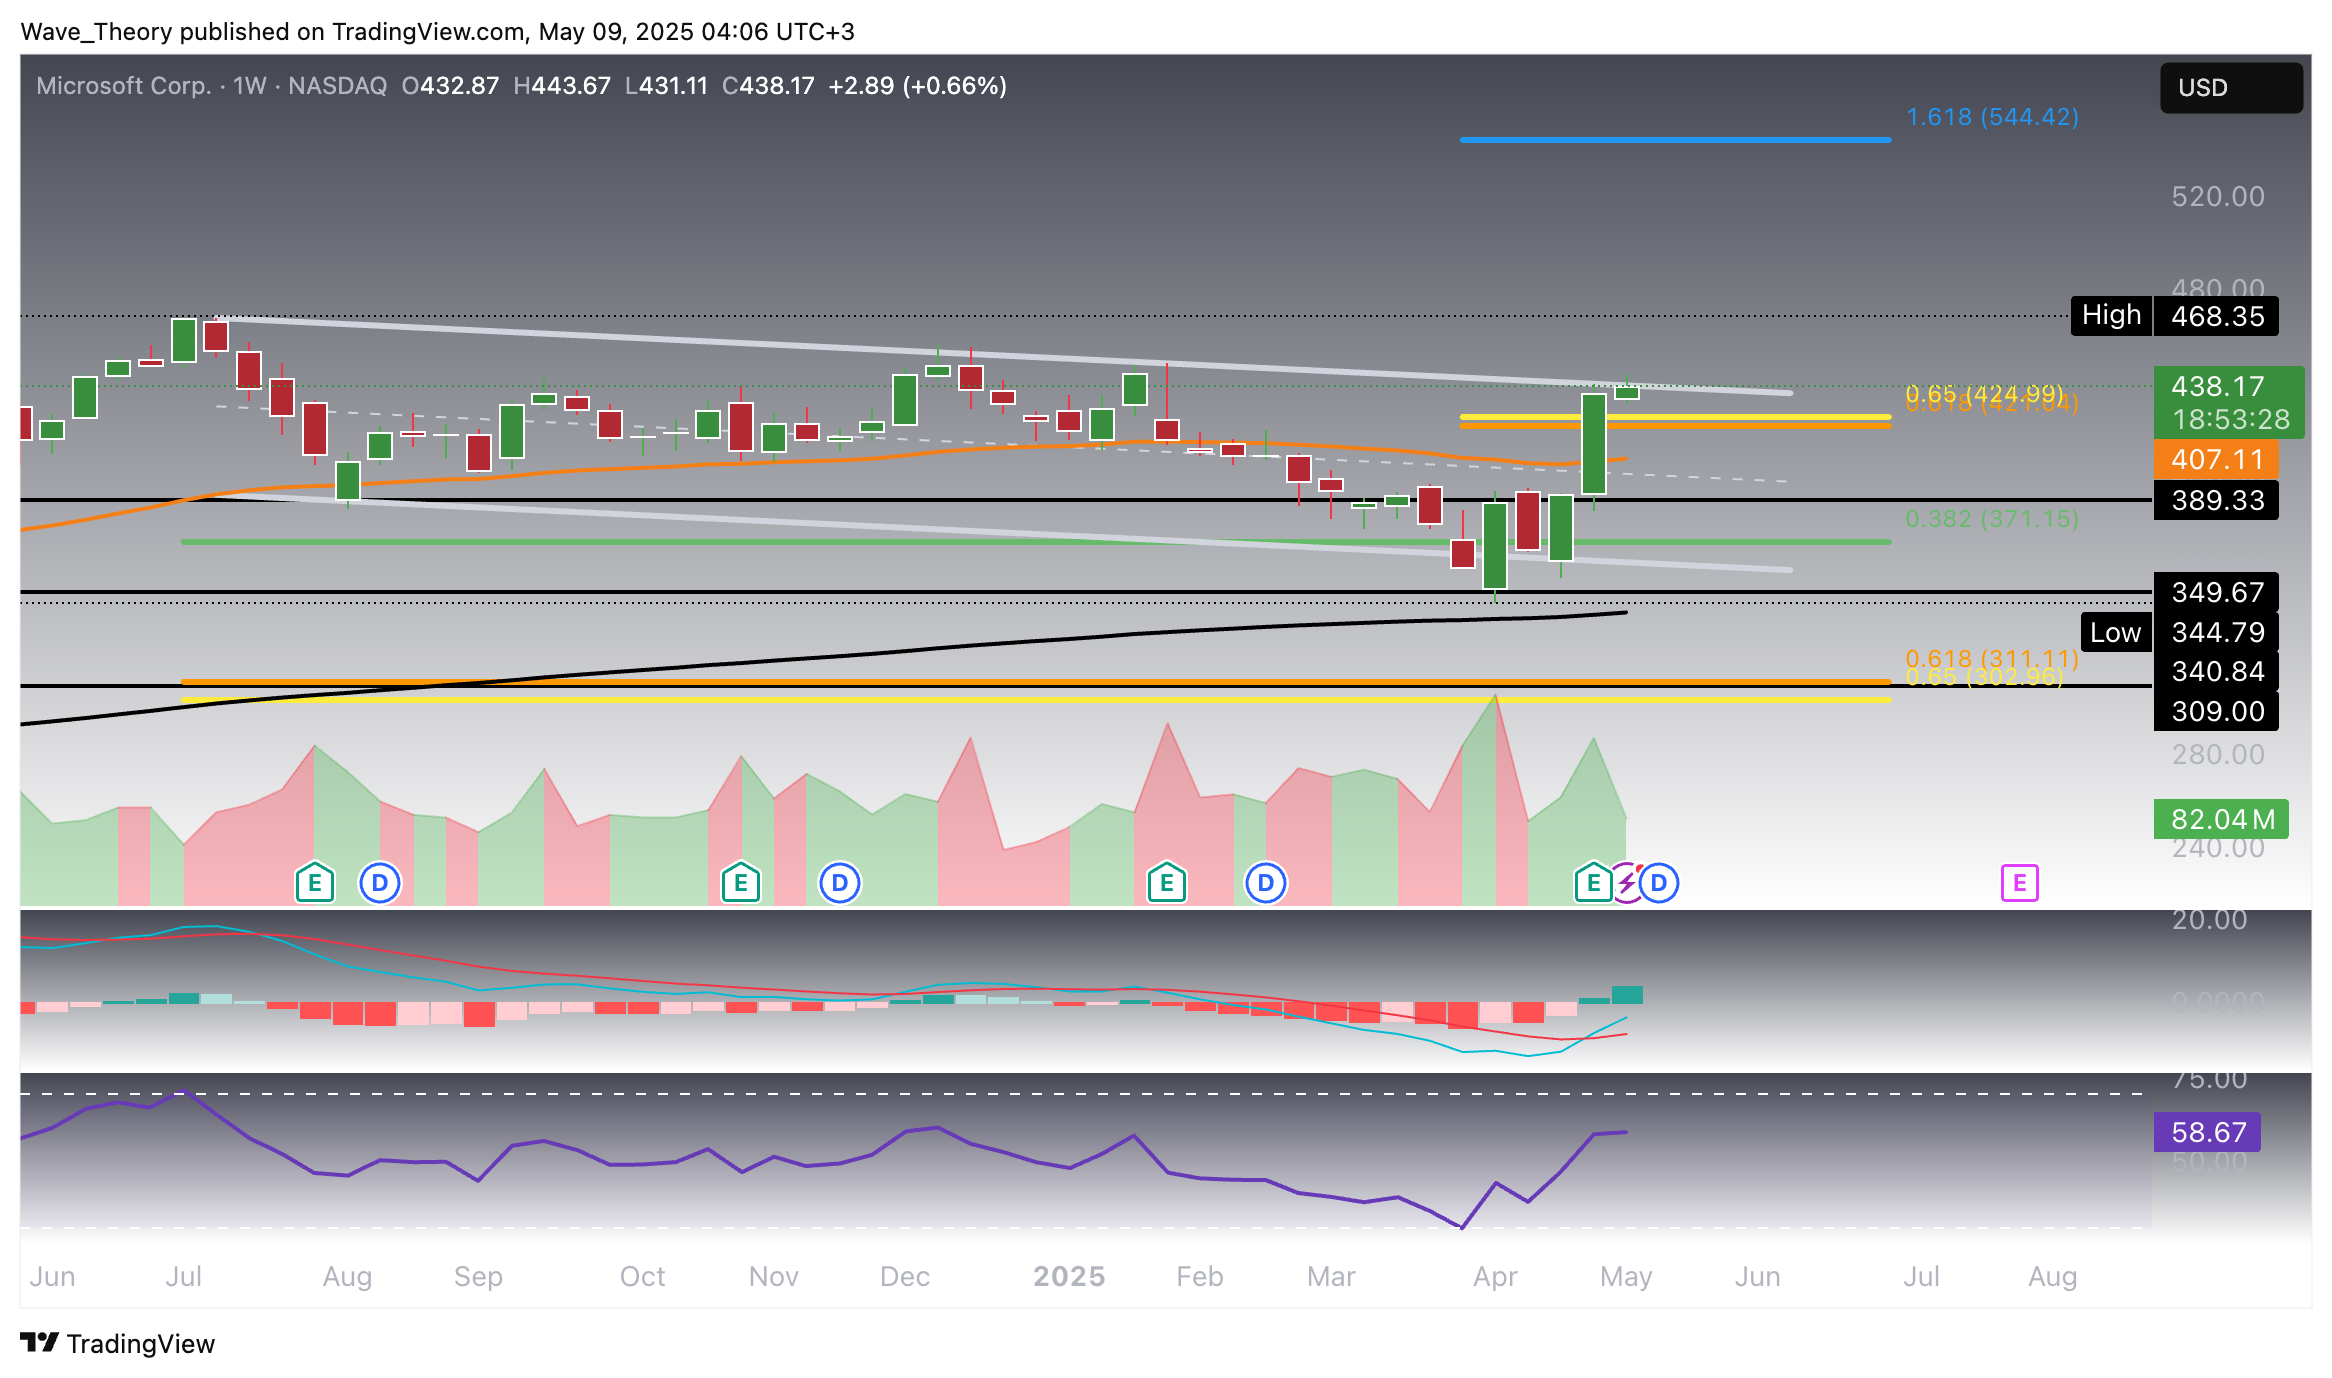
On the weekly timeframe, Microsoft (MSFT) continues to strengthen its bullish posture. The exponential moving averages (EMAs) remain in a golden crossover formation, reinforcing the medium-term bullish trend and confirming the shift in momentum.
In tandem, the MACD lines have executed a bullish crossover, and the MACD histogram has printed three consecutive weeks of higher bullish bars, signaling increasing upward momentum. This confluence of signals underlines a strong continuation bias as MSFT emerges from its prior consolidation.
The RSI remains in neutral territory, not signaling overbought or oversold conditions—effectively leaving room for further upside without technical exhaustion. From a structural standpoint, MSFT has decisively broken above the golden ratio resistance at $425, which had previously acted as the defining ceiling of the correction phase. This breakout invalidates the bearish corrective structure and reaffirms MSFT’s placement within its primary uptrend.
At present, the stock is contending with its final resistance level before a potential acceleration toward the 1.618 Fibonacci extension at $544. A confirmed weekly close above this zone would likely trigger a sustained move higher, aligning with the bullish signals from both price action and momentum indicators.
Microsoft
Daily Chart: Bullish Setup Developing, but Not Yet Confirmed
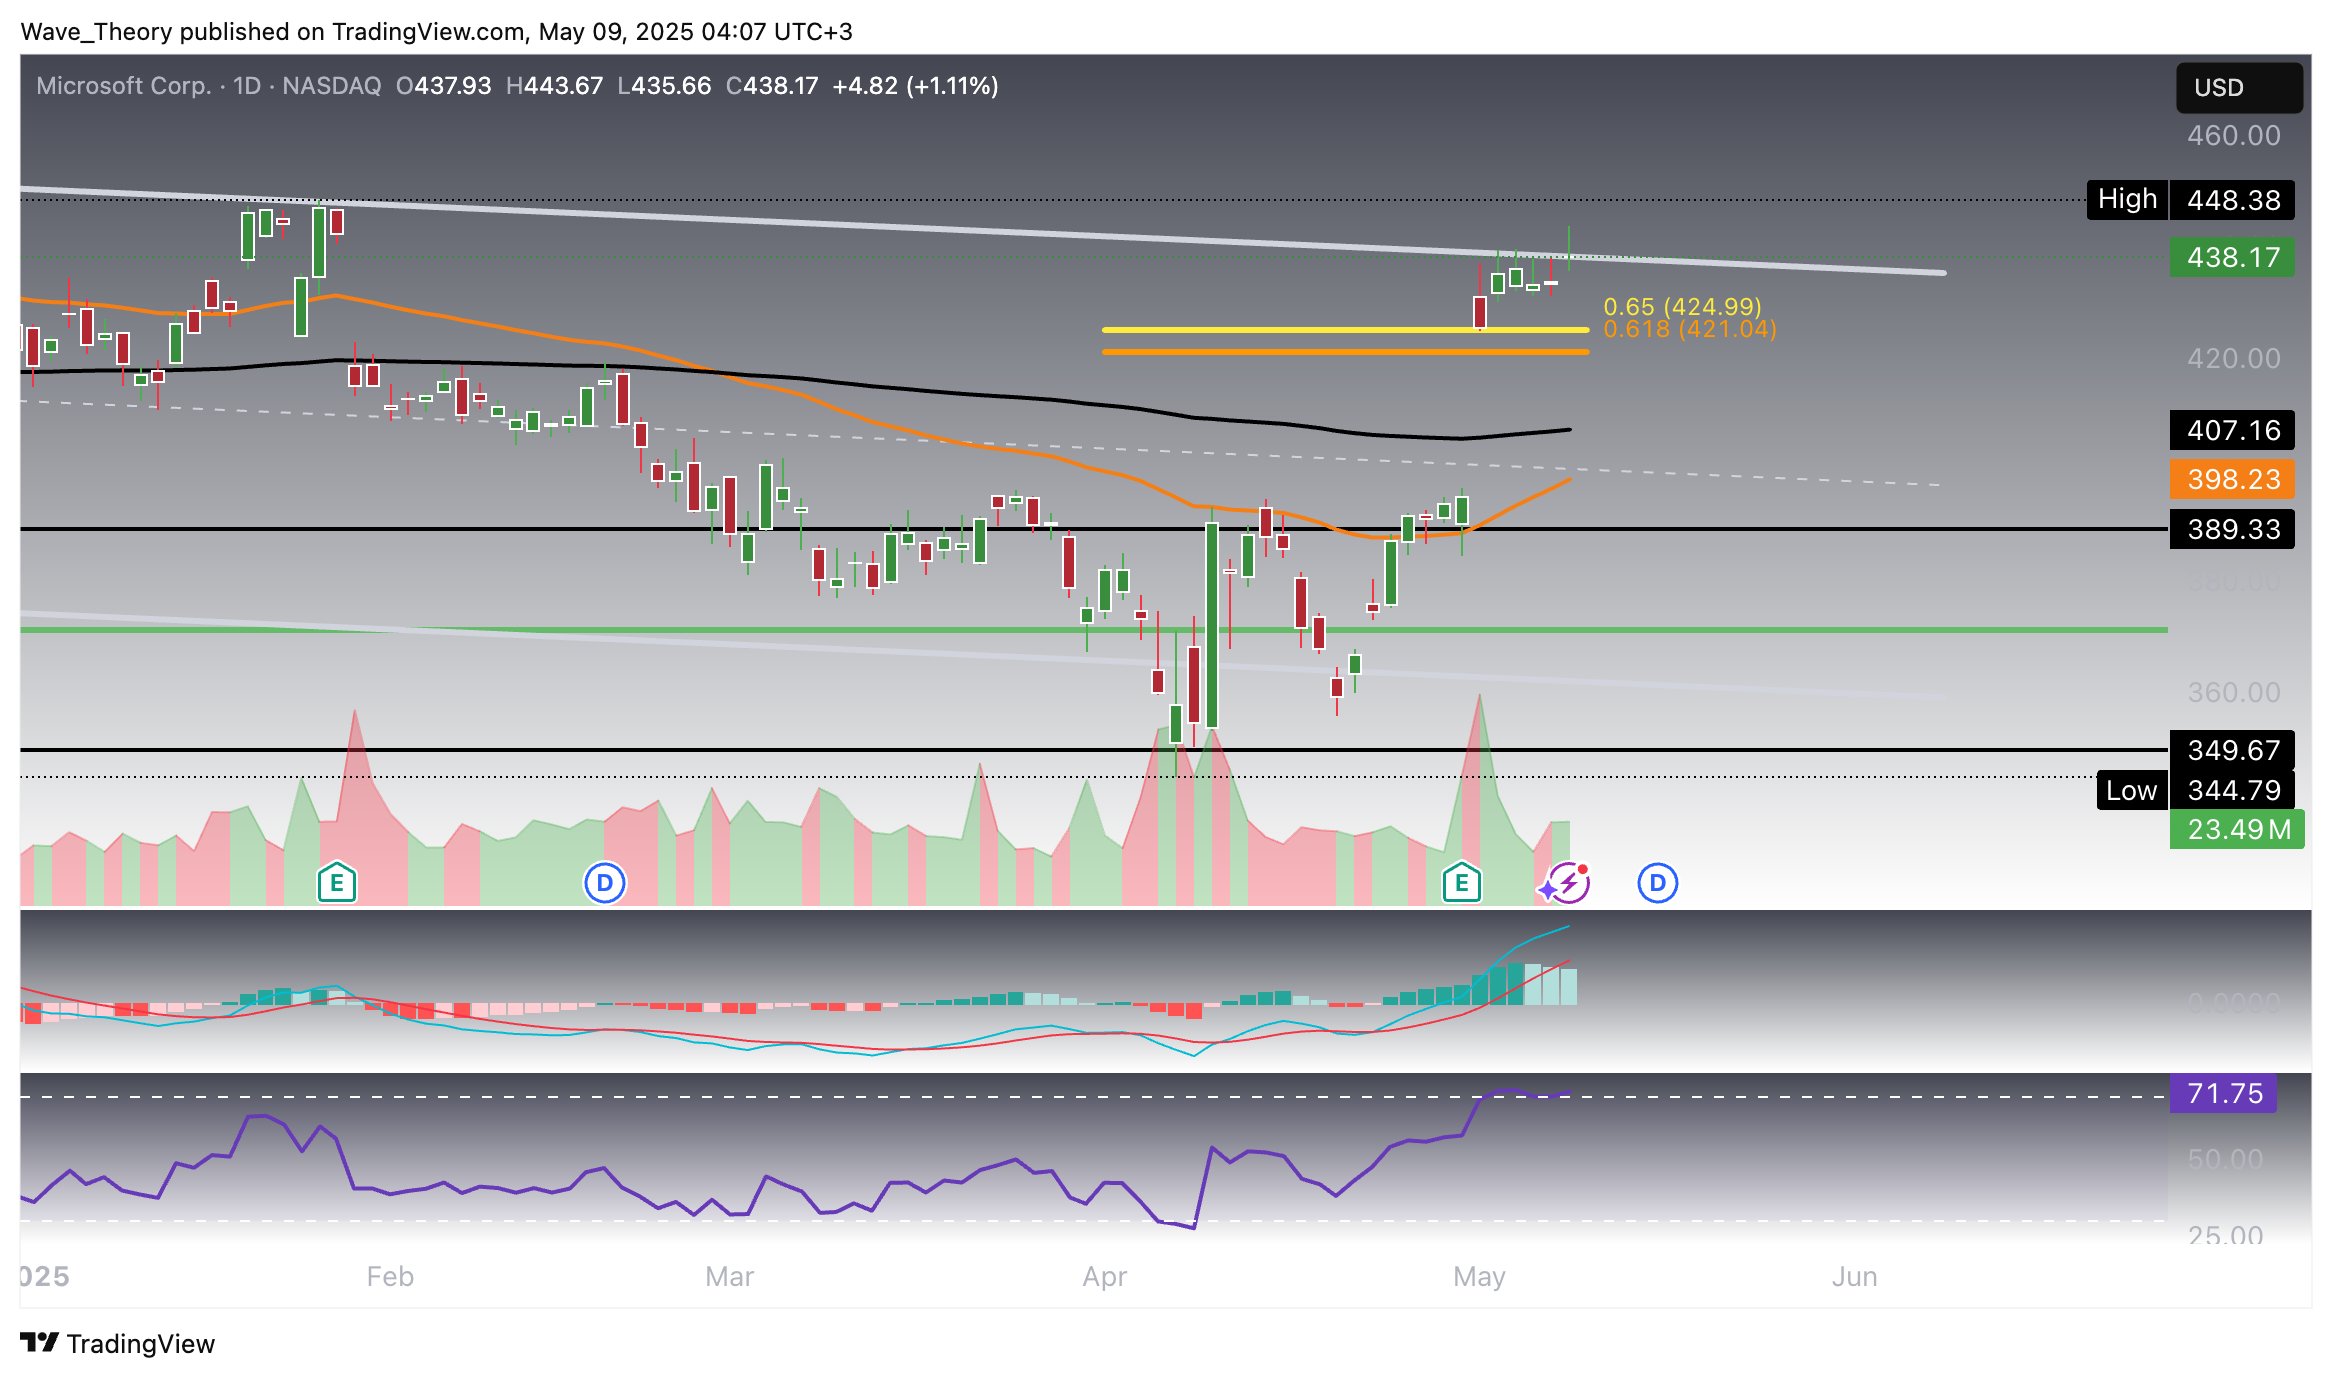
On the daily chart, MSFT shows signs of a pending trend shift. The EMAs are on the verge of replacing the current death cross with a golden crossover, which would confirm short- to mid-term bullish momentum. For now, however, the EMAs remain in a bearish alignment.
The MACD lines are still crossed bullishly, but the histogram has been ticking lower for three consecutive sessions, suggesting short-term weakening momentum. Meanwhile, the RSI is nearing overbought territory, though it has yet to form any bearish divergence. The structure points to a developing bullish setup, but confirmation is still pending.
Microsoft
Microsoft 4H Chart: Golden Crossover On The Horizon
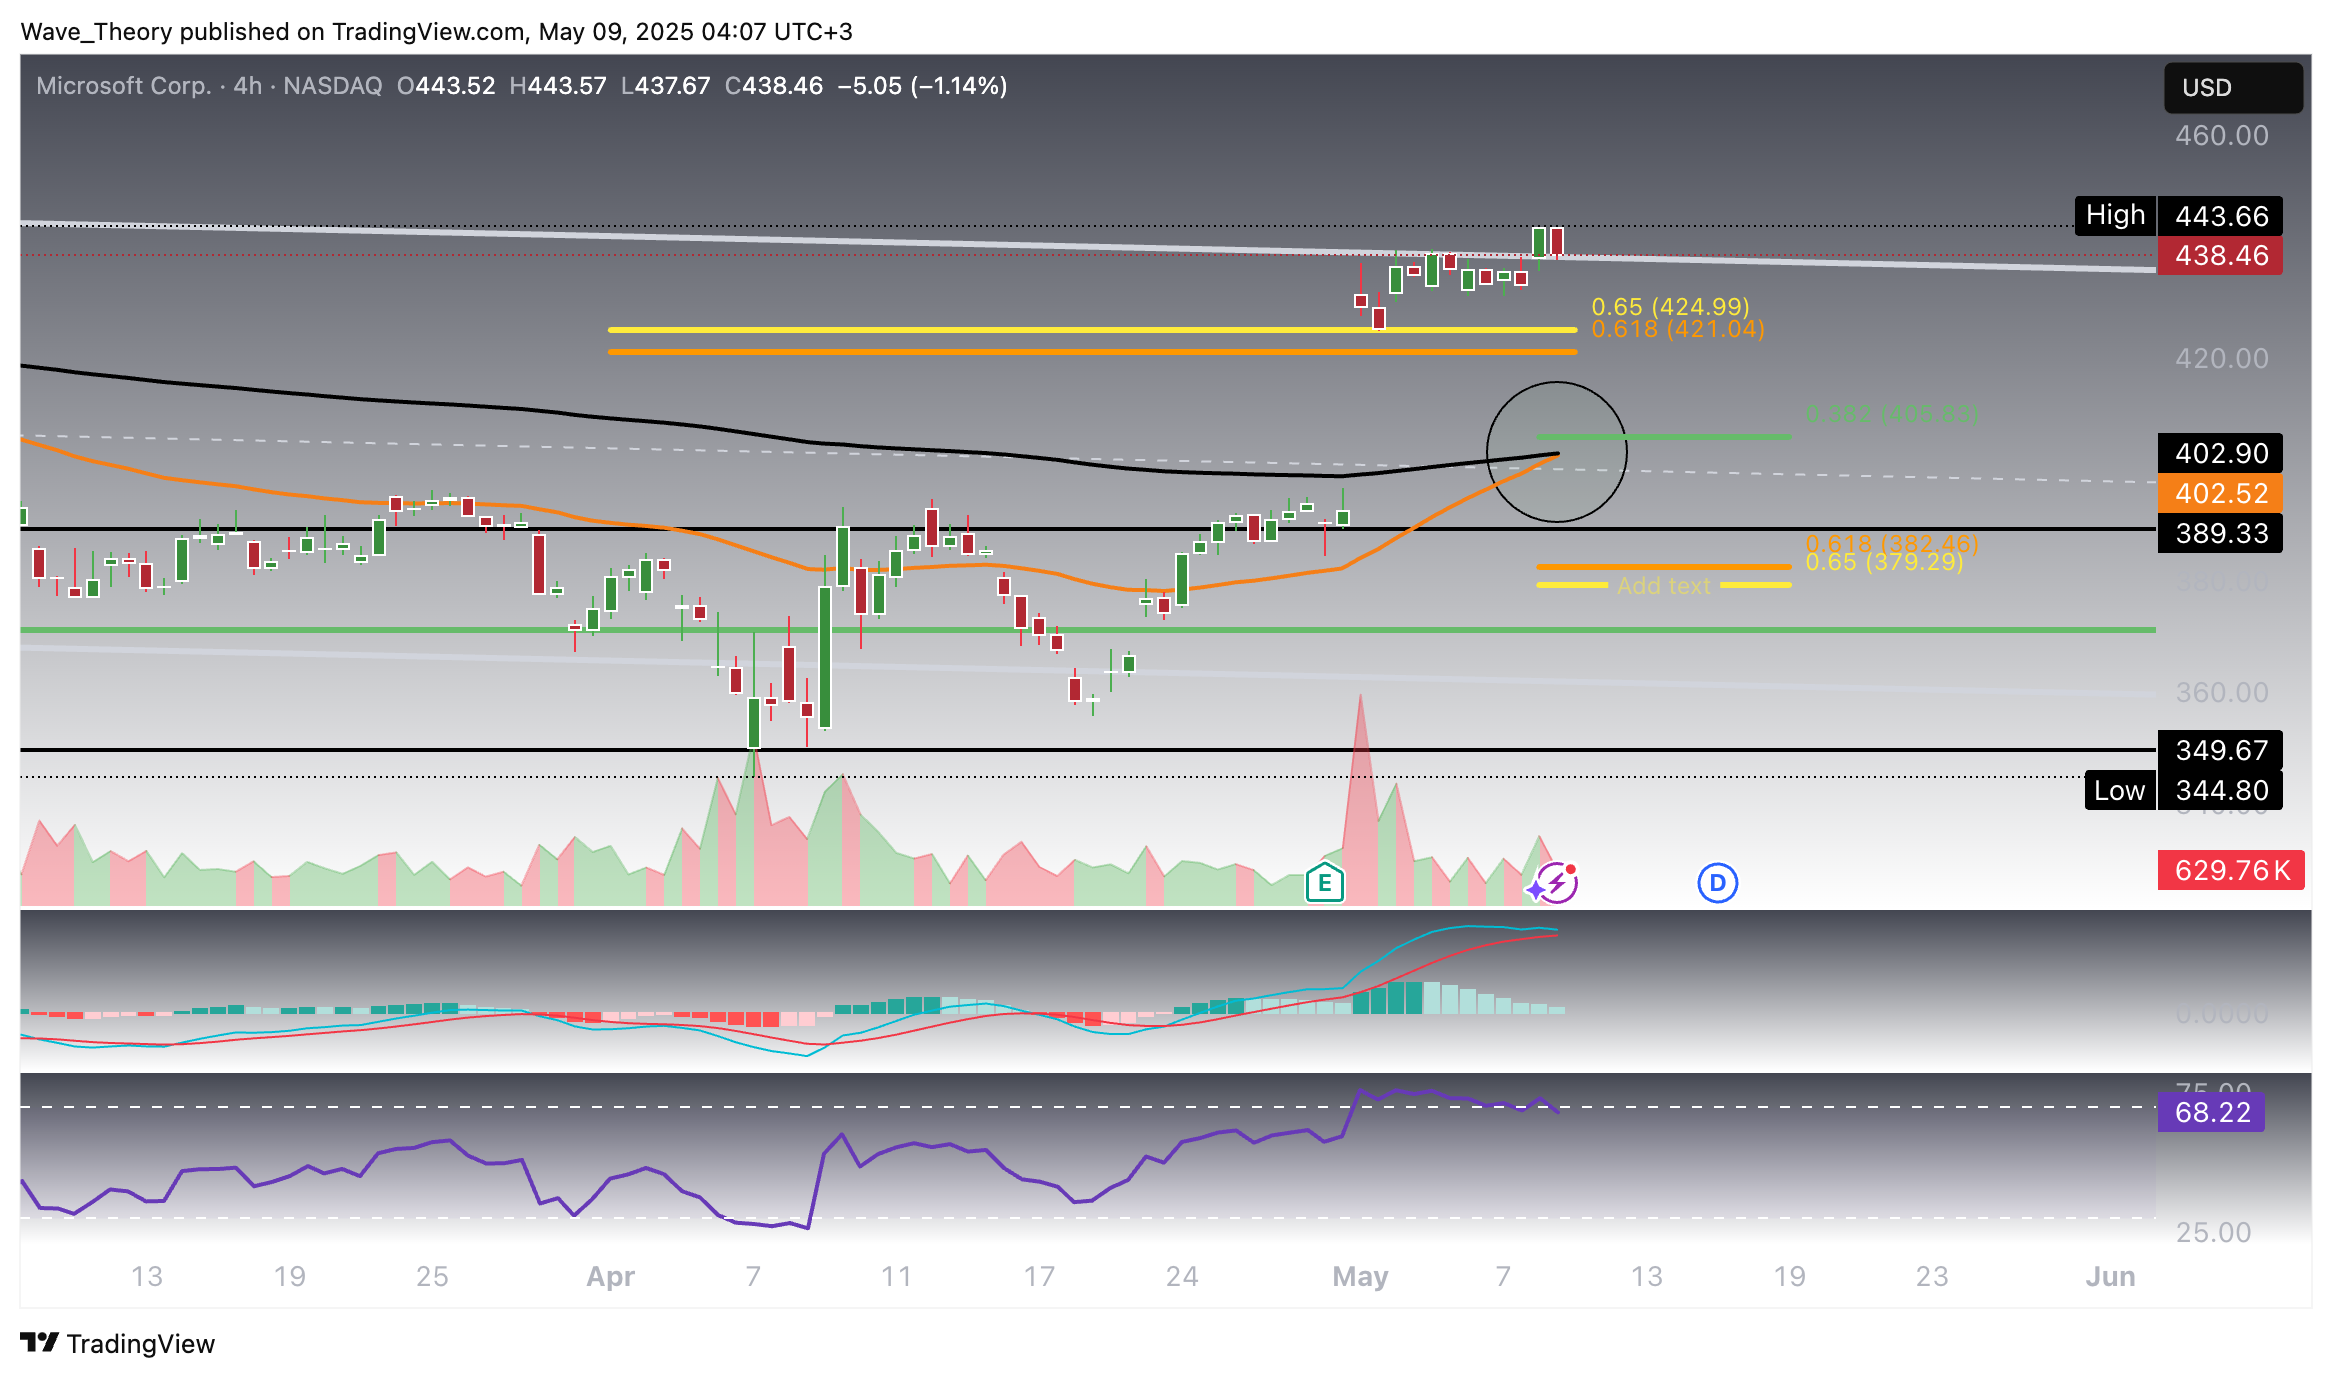
The 4H chart reflects a mixed but maturing setup. While the MACD lines remain in a bullish crossover, the histogram has been trending lower, and a bearish crossover appears imminent. At the same time, the EMAs are on track to form a golden crossover, which would confirm a bullish trend in the short term.
The RSI briefly entered overbought territory but has since returned to neutral, now exhibiting a bearish divergence, hinting at possible near-term weakness. Should a correction unfold, key Fibonacci support levels lie at $406 and $380, offering potential reentry zones.
Konstantin Kaiser comes from a data science background and has significant experience in quantitative trading. His interest in technology took a notable turn in 2013 when he discovered Bitcoin and was instantly intrigued by the potential of this disruptive technology.