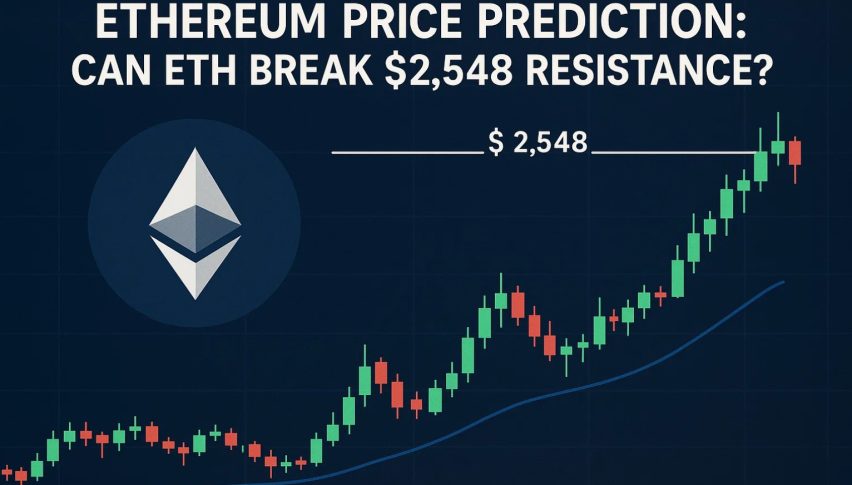
Ethereum Price Prediction: Can ETH Break $2,548 Resistance?
Ethereum price attempts recovery near $2,505 after sharp midweek dip. Bulls eye $2,548 resistance as technical signals hint at potential...
Quick overview
Ethereum’s price surged above $2,500—rebounding above $2.447 support zone. Fueled by optimism and a short-term divergence from Bitcoin’s dominance, the move was a new monthly high and sparked hopes for a bigger rally.
According to crypto analyst Gianni Pichichero, the Monday and Tuesday closes were institutional buying. Tuesday’s high set the stage for a breakout, but the momentum faded by Wednesday.
Wednesday was the first red daily candle of the week, followed by Thursday’s drop back into early week territory. The reversal erased most of the week’s gains.
Bearish Momentum Signals Possible Re-test of $2,400
By Friday, Ethereum was below the $2,500 short-term support and struggling beneath the $2,700 resistance. Pichichero pointed out several bearish signals strengthening:
- Consecutive red candles on the daily chart
- Price back into the weekly range
- Reversal patterns (e.g. double tops)
- Fading volume, confirming buyers are losing interest
He said any short-term bounce should be viewed with skepticism. Without volume or bullish candlestick confirmation, rallies are exit opportunities not new entries. $2,400 is the level to watch, with 11% drop from last week’s high if support fails.
Bulls Target $2,548 for Breakout Confirmation
Weekend brought some life. ETH/USD bounced from the 0.236 Fib at $2,495 and went above $2,500. Price is now testing the 50-period EMA at $2,510 which has been resistance throughout the downtrend.
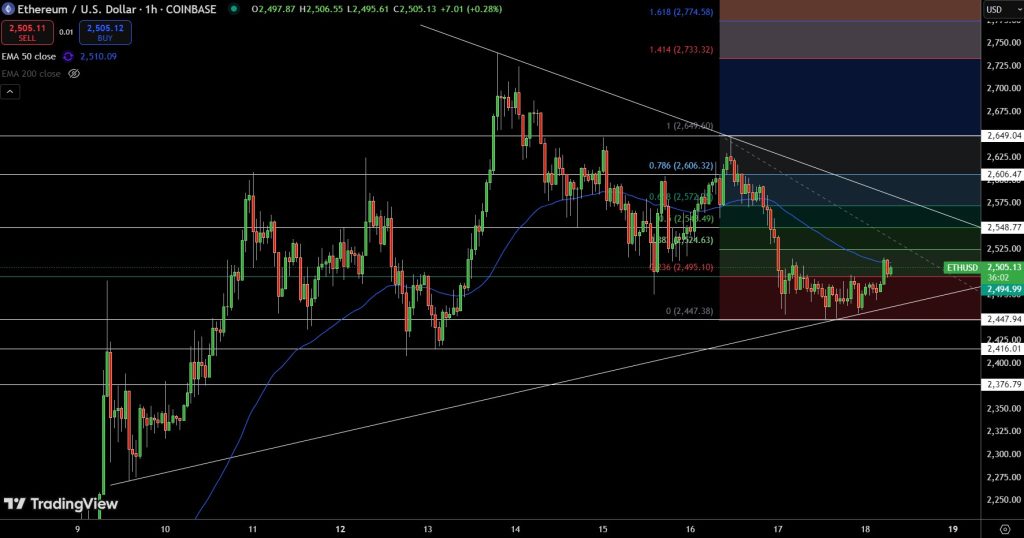
Candle structure is improving—smaller wicks, bigger bodies—buyers may be taking control. ETH is testing a confluence of resistance: the trendline from $2,649 and the 0.5-0.618 Fib zone ($2,549-$2,572). A close above $2,548 could open up $2,606 and $2,649.
Trade Setup:
- Entry: Close above $2,548
- Targets: $2,606 and $2,649
- Stop-loss: Below $2,494
Newbies: Fibonacci levels are like stairs. ETH fell, found support and is trying to climb. But unless it closes above $2,548, it’s still a risk of falling.
- Check out our free forex signals
- Follow the top economic events on FX Leaders economic calendar
- Trade better, discover more Forex Trading Strategies
- Open a FREE Trading Account
- Read our latest reviews on: Avatrade, Exness, HFM and XM
Related Articles
Sidebar rates
