FTSE 100 Keeps Marching Toward ATH Despite UK Inflation Surge in April
UK April CPI inflation posted a jump, with Core CPI YoY increasing to 3.8%, but the FTSE 100 and GBP had another positive day.

Quick overview
- UK April CPI inflation rose sharply, with Core CPI YoY increasing to 3.8%, indicating renewed price pressures.
- The FTSE 100 index closed at 8,781.12, gaining 0.94% amid positive trade developments and improving risk sentiment.
- The GBP/USD pair has recovered significantly, approaching the 1.34 level, reflecting a shift in sentiment towards UK assets.
- Despite the positive market movements, underlying economic fragility remains, particularly in the services sector.
UK April CPI inflation posted a jump, with Core CPI YoY increasing to 3.8%, but the FTSE 100 and GBP had another positive day.
FTSE 100 Climbs Ahead of CPI Data Amid Trade Optimism
London’s FTSE 100 index closed at 8,781.12, marking a strong 0.94% gain (an increase of 82 points) in Tuesday’s session. The rally came just ahead of the UK’s April CPI inflation report, which traders anticipated would deliver a sharp rebound in price growth.
Market forecasts suggested that headline inflation would rise from 2.6% in March to 3.3% in April, with core inflation expected to jump to 3.6% year-over-year—a potential setback for hopes of near-term monetary easing.
FTSE 100 Chart Weekly – Strong Rebound Off the MAs

Despite inflation anxieties, equity investors appeared more focused on positive trade developments and improving risk sentiment. The FTSE 100 has now risen roughly 17% from its April lows, bolstered in part by renewed momentum tied to diplomatic breakthroughs.
This includes the formal announcement of a trade agreement between the UK and India, and a resurgence in talks surrounding a potential U.S.-UK trade deal, both of which have revived investor appetite for British assets.
Pound Strengthens as Risk Appetite Returns
Currency markets have also responded to the more upbeat tone. The GBP/USD pair has staged a notable recovery, pushing toward the 1.34 handle after bottoming near 1.21 in mid-January. On the weekly chart, the 200-day simple moving average (SMA) near the 1.31 level has served as a critical support zone, helping guide the recent upside.
GBP/USD Chart Weekly – The 200 SMA Has Turned Into Support Now
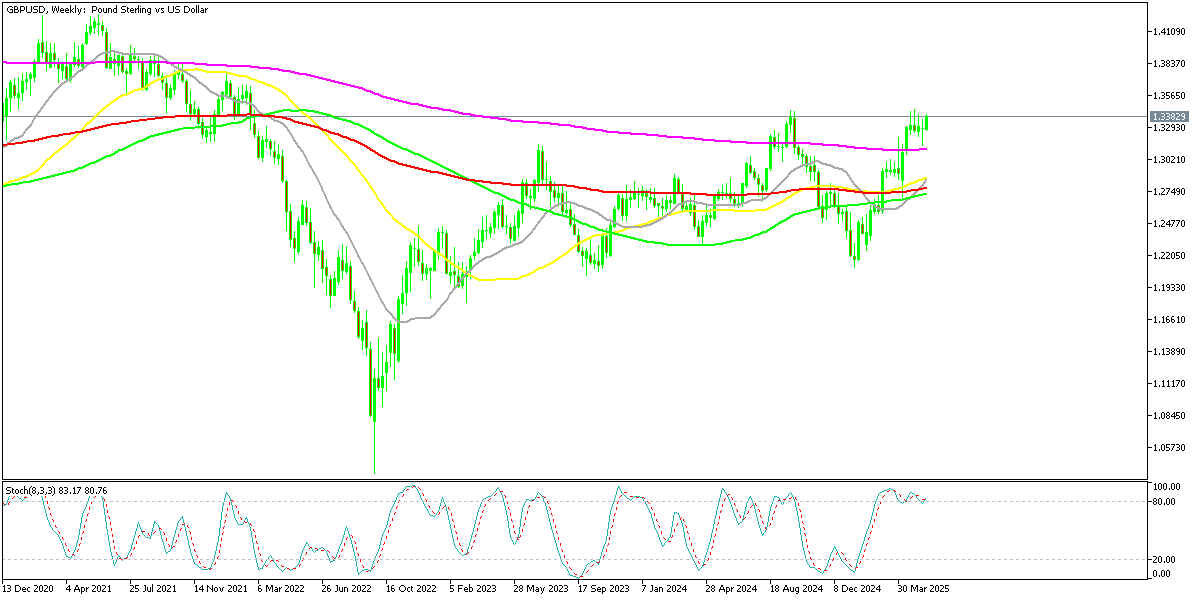
The pound has now gained roughly two cents this week, reflecting a broader shift in sentiment toward UK assets and is looking at placing the highest price since 2022 now.
Caution Remains Amid Underlying Economic Fragility
Beneath the surface, however, not all indicators are flashing green. The UK economy continues to show signs of structural weakness, particularly in the services sector, which remains under pressure. While traders are currently prioritizing trade diplomacy and global sentiment, the durability of the rally may hinge on whether underlying growth metrics begin to stabilize in the months ahead.
UK April CPI Inflation Report
Headline CPI Rebounds Sharply
- UK consumer price inflation accelerated to 3.5% year-on-year in April, surpassing both forecasts and the previous month’s figure, signaling renewed price pressures across the economy.
Core Inflation Pushes Higher
- Core CPI rose to 3.8% y/y, reflecting persistent underlying inflation in goods and services beyond energy and food, and suggesting broader cost pressures.
Services Inflation Hits BoE Focus Point
- Services CPI jumped to 5.4% y/y — a key metric for the Bank of England — indicating stronger-than-expected price growth in domestically driven sectors like transport and hospitality.
Policy Implications Loom
- With inflation now running hotter than the BoE’s projections, traders may scale back expectations of near-term interest rate cuts, and policymakers may face renewed scrutiny over timing.
GBP/USD Live Chart
- Check out our free forex signals
- Follow the top economic events on FX Leaders economic calendar
- Trade better, discover more Forex Trading Strategies
- Open a FREE Trading Account
- Read our latest reviews on: Avatrade, Exness, HFM and XM
Related Articles


Sidebar rates
Related Posts
