Shiba Inu Eyes Breakout as Whales Load Up & Burn Rate Soars
Shiba Inu (SHIB) is at a technical and fundamental crossroads. Currently trading at $0.00001531, up 2% intraday
Quick overview
- Shiba Inu (SHIB) is currently testing resistance at $0.00001550 while trading at $0.00001531, showing a 2% intraday increase.
- Whale accumulation has surged, with 530 trillion SHIB added to wallets since January 2025 and a significant decline in exchange supply.
- The burn rate for SHIB has skyrocketed by 11,000% in the last 24 hours, with over 28 million SHIB burned, indicating potential bullish momentum.
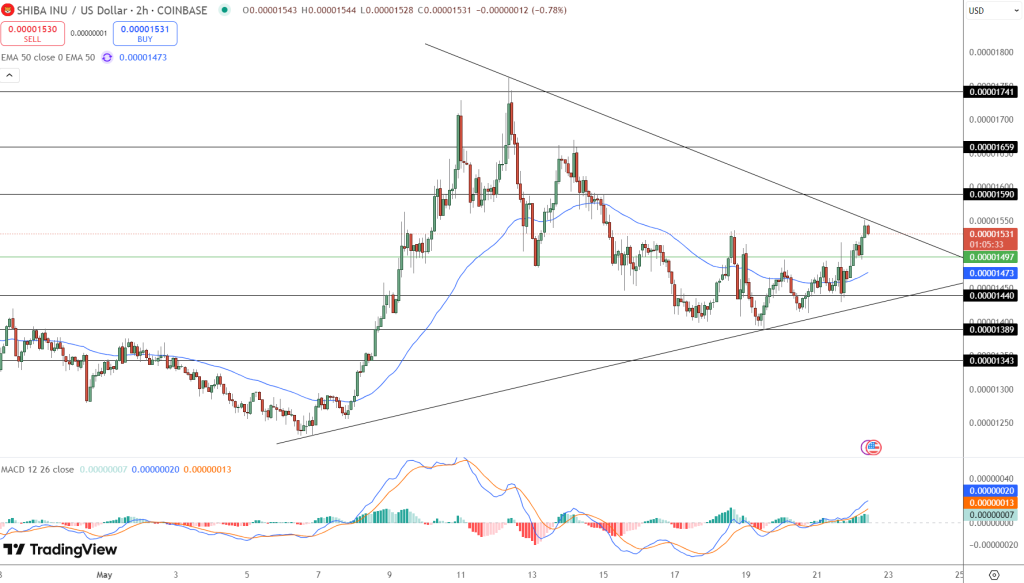
- Technically, SHIB has formed a symmetrical triangle and could see volatility, with a breakout above $0.00001590 potentially leading to higher price targets.
Shiba Inu (SHIB) is at a technical and fundamental crossroads. Currently trading at $0.00001531, up 2% intraday, the meme token is testing the resistance zone near $0.00001550 which is also the apex of the multi-week symmetrical triangle.
Since mid 2021 SHIB has been stuck in a wide range between $0.000005 and $0.000096 and failed to develop a sustained trend despite high community interest, burns and whale accumulation.
In 2024 SHIB retook the $0.000014 resistance for the first time in over a year and now eyes the next milestone: the 200-day moving average at $0.0000182.
Whale Accumulation and Exchange Supply Decline
Whales are buying SHIB. Santiment on-chain data shows that since January 2025 whales have added 530 trillion SHIB to their wallets. 5 trillion SHIB have been removed from exchanges and 141 trillion SHIB are currently held on exchanges. This supply squeeze is similar to pre-rally behavior in early 2021.
Key Accumulation Metrics:
-
530T SHIB added by whales in 2025
-
5T SHIB removed from exchanges recently
-
141T SHIB held on exchanges
This and the tightening price action increases the chances of a breakout.
Burn Rate Surges 11,000% in 24 Hours
Adding to the bullishness is the burn rate explosion. Shibburn shows that over 28 million SHIB were burned in the last 24 hours which is a 11,000% increase.
Historically burns have preceded big rallies, especially SHIB’s 2021 rally after Vitalik Buterin burned 400 trillion tokens.
Technical Analysis: Compression Before Breakout?
From a technical perspective SHIB has formed a perfect symmetrical triangle and is about to get volatile. It just cleared the resistance at $0.00001440 and $0.00001497 and is supported by the 50-EMA at $0.00001473.
The MACD has crossed below the zero line and the histogram is widening which means upside momentum is building. If SHIB breaks and closes above $0.00001590 it could go to $0.00001659 and $0.00001741.
If it stalls near resistance and forms a spinning top or shooting star it could pull back to $0.00001440 or triangle support. For bulls a daily close above $0.00001590 is the breakout confirmation.
- Check out our free forex signals
- Follow the top economic events on FX Leaders economic calendar
- Trade better, discover more Forex Trading Strategies
- Open a FREE Trading Account
- Read our latest reviews on: Avatrade, Exness, HFM and XM
Related Articles
Sidebar rates
Related Posts
