Pepe Coin Drops Below $0.0000103: Bearish Signals Point to 15% Decline
PEPE (PEPE) is trading close to a critical ascending trendline support at $0.0000103. As of Tuesday, PEPE had already fallen...

Quick overview
- PEPE is trading near a critical support level at $0.0000103 and has fallen below its 50-day EMA, indicating a potential downtrend.
- The Relative Strength Index (RSI) is at 40, and the MACD shows bearish momentum, suggesting further losses may occur.
- On-chain data reveals a significant shift in investor behavior, with holders realizing losses and an increase in supply on exchanges.
- PEPE's future price movement hinges on its ability to hold the $0.0000103 support level, with bearish targets set at $0.0000088 and $0.0000079.
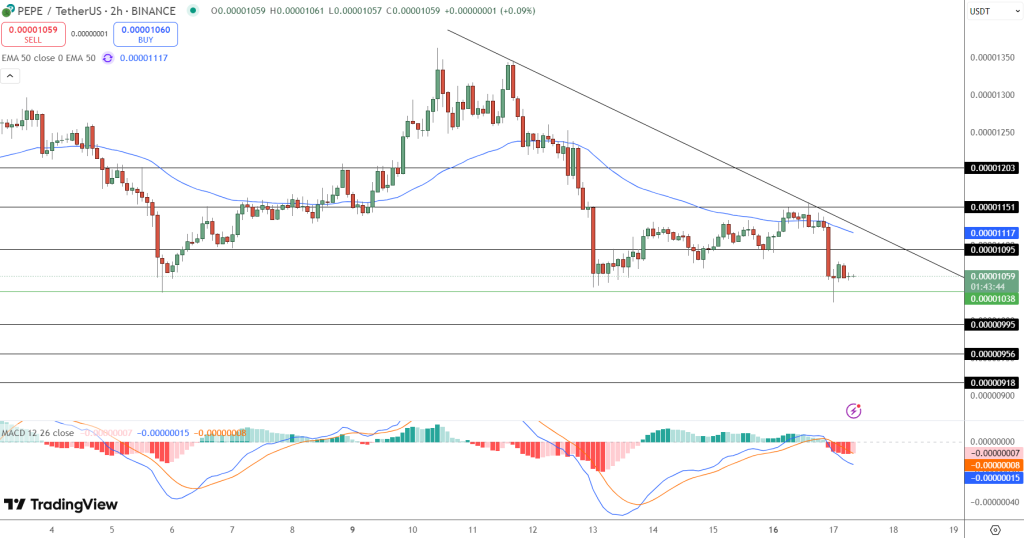
PEPE (PEPE) is trading close to a critical ascending trendline support at $0.0000103. As of Tuesday, PEPE had already fallen below its 50-day Exponential Moving Average (EMA) at $0.0000114, down 9% from last Thursday to Monday. A daily close below this trendline will confirm the correction and set up for more losses.
On the charts, the Relative Strength Index (RSI) is at 40, showing bearish momentum. The Moving Average Convergence Divergence (MACD) had a bearish crossover last week and is printing red bars below the zero line—more evidence of a downtrend.
If PEPE fails to hold $0.0000103, the next support is at $0.0000088, a 15% drop. Below that, $0.0000079.
On-Chain Data Shows Bearish Sentiment
Santiment’s Network Realized Profit/Loss (NPL) metric shows a big change in investor behavior. Sunday to Monday, NPL went from 189,150 to -50.21 million. PEPE holders are realizing losses—a clear sign of decreasing confidence.
At the same time, the supply of PEPE on exchanges increased from 103.55 trillion to 104.12 trillion. More tokens being prepared for sale will add to the pressure.
This bearish on-chain data is reflected in the overall market outlook, with IntoTheBlock’s indicators also showing a negative signal.
Pepe Price Outlook: Key Scenarios
Pepe’s next move depends on how it reacts to $0.0000103. Here’s a quick summary:
Bearish:
- Daily close below $0.0000103
- Target: $0.0000088 (15%)
- $0.0000079 if weakness continues
Bullish:
- Bounce from $0.0000103 trendline
- Target: 50-day EMA at $0.0000114
Keep an eye on the daily close and on-chain. For now, bear.
- Check out our free forex signals
- Follow the top economic events on FX Leaders economic calendar
- Trade better, discover more Forex Trading Strategies
- Open a FREE Trading Account
- Read our latest reviews on: Avatrade, Exness, HFM and XM
Related Articles


Sidebar rates
Related Posts
