Solana Falls Below $150: Is a Drop to $130 Inevitable? Key Levels to Watch
Solana (SOL) has dropped below key levels, continuing the recent slide. The price started to decline after failing to hold above $160
Quick overview
- Solana (SOL) has fallen below key levels, struggling to maintain above $150 and showing bearish momentum.
- The price has dropped to $145, with resistance levels at $150, $152, $155, and $160 that need to be cleared for a bullish reversal.
- If SOL fails to reclaim $152, it risks further declines, potentially reaching support levels at $145, $142, and $130.
- Current indicators suggest a cautious approach, as extended losses are possible if the price remains below $150.
Solana (SOL) has dropped below key levels, continuing the recent slide. The price started to decline after failing to hold above $160, a major resistance. Like Bitcoin and Ethereum, Solana broke below $155 and $150, a big change in sentiment.
According to Kraken, the hourly chart shows a break below the bullish trend line at $150. The price went as low as $145 before consolidating. Solana is now below both $150 and the 100-hourly SMA, bearish momentum is in play.
The recent bounce stalled at the 23.6% Fibonacci retracement of the $158 to $145 move, not much upward strength. For a bounce, SOL needs to reclaim $152, which is the 50% Fibonacci.
Solana Resistance Levels to Watch
Solana needs to clear these resistance levels to get bullish:
- $150: Immediate resistance
- $152: Key level aligned with 50% Fibonacci
- $155: Breakout point for upward momentum
- $160: Major resistance; close above could target $165
A move above $155 would flip the momentum in favor of the bulls, could target $160 or $165 in the short term.
Solana Downside Risks and Support Zones
If Solana can’t get above $152, another down move could happen. Traders are watching the $145 zone for stability. A break below this level could push the price to:
- $142: First support
- $130: Major psychological and technical level
- $125: Next target if bearish trend accelerates
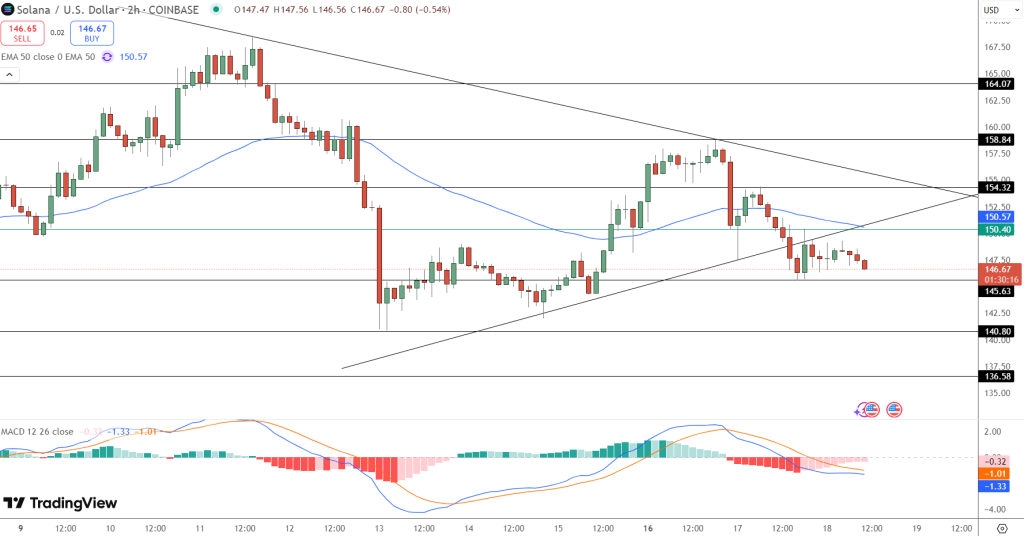
The hourly MACD is getting stronger in the bearish zone, RSI is below 50, both indicators say more downside.
Solana can’t break above resistance and momentum indicators are negative, traders should be cautious. Consolidation below $150 could mean a deeper correction.
Conclusion
Solana can’t hold above $150, extended losses are possible. Unless the price gets back to the $152-$155 resistance area soon, the risk of a drop to $130 is high. Investors should watch the price action and volume signals before making a move.
- Check out our free forex signals
- Follow the top economic events on FX Leaders economic calendar
- Trade better, discover more Forex Trading Strategies
- Open a FREE Trading Account
- Read our latest reviews on: Avatrade, Exness, HFM and XM
Related Articles


Sidebar rates
Related Posts
