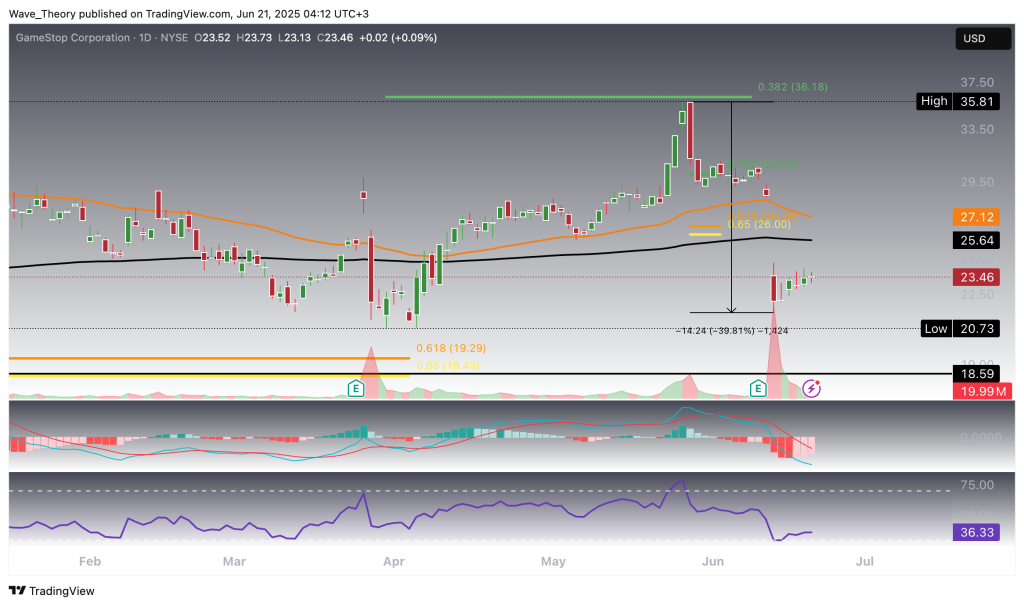
GameStop (GME) stock was sharply rejected at the 0.382 Fibonacci resistance level at $36.20, triggering a steep decline of nearly 40%. This sudden breakdown raises a critical question: is further downside on the horizon, or could GME be setting up for a bullish rebound from current levels?
GameStop (GME) Stock Drops Sharply — Is More Downside Ahead?
•
Last updated: Saturday, June 21, 2025

Quick overview
- GameStop (GME) stock faced a sharp decline to $21.54 after being rejected at the 0.382 Fibonacci resistance level of $36.20.
- The technical outlook has worsened, with the potential formation of a death cross on the daily chart indicating bearish momentum.
- Despite some early signs of stabilization, GME's broader structure remains vulnerable unless it can reclaim critical resistance levels.
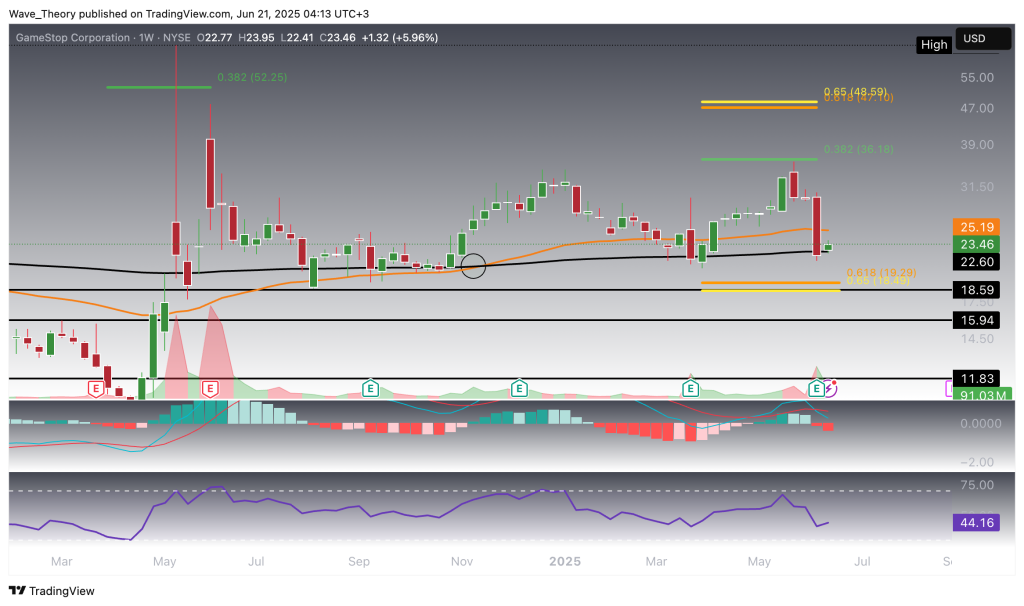
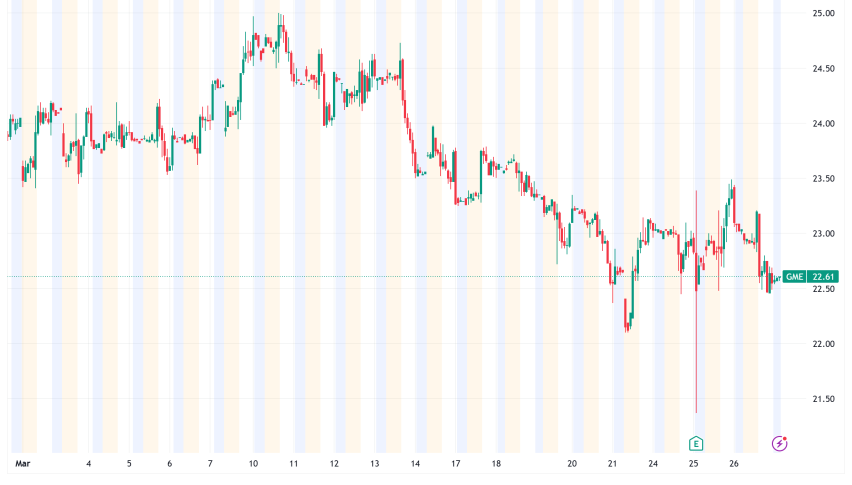
- Key support is currently being tested at the 200-week EMA near $22.60, which could determine the stock's future trend.
GameStop (GME) Stock Drops To $21.54
GameStop (GME) stock failed to break through the 0.382 Fibonacci resistance at $36.20 and instead faced a sharp rejection, triggering a significant downward move to $21.54. This sell-off resulted in a decisive break below the golden ratio support at $26.00, a key level for maintaining the bullish structure.
Technically, the outlook has deteriorated: the exponential moving averages (EMAs) are on the verge of forming a death cross on the daily chart, which would bearishly confirm the trend in the short- to medium-term. The MACD lines have already crossed bearishly, reinforcing the shift in momentum, while the RSI remains in neutral territory, offering no clear directional bias.
Notably, the MACD histogram has been ticking higher for the past three sessions, suggesting that bearish momentum may be slowing. If GME initiates a recovery, it faces initial resistance at the 200-day EMA at $25.64, followed by a key level at $27.12, which aligns with previous support-turned-resistance.
In summary, while short-term momentum shows early signs of stabilization, the broader structure remains vulnerable unless GME can reclaim critical resistance levels and invalidate the looming death cross.
ChatGPT said:
GameStop (GME) Stock Finds Support at the 200-Week EMA
On the weekly chart, GameStop (GME) is currently testing key support at the 200-week EMA near $22.60, a level that could serve as a potential pivot for a bullish rebound. The EMAs remain in a golden crossover configuration, confirming the mid-term trend as bullish. However, momentum has weakened considerably: the MACD lines have crossed bearishly, and the histogram has been ticking lower for four consecutive weeks, signaling sustained downside pressure.
If the 200-week EMA fails to hold, the next major support lies at the Fibonacci level around $18.50, followed by a broader support zone between $16.00 and $18.60. While the overall trend remains intact, this critical support level will likely determine whether GME resumes its broader uptrend—or extends its correction deeper into key structural levels.
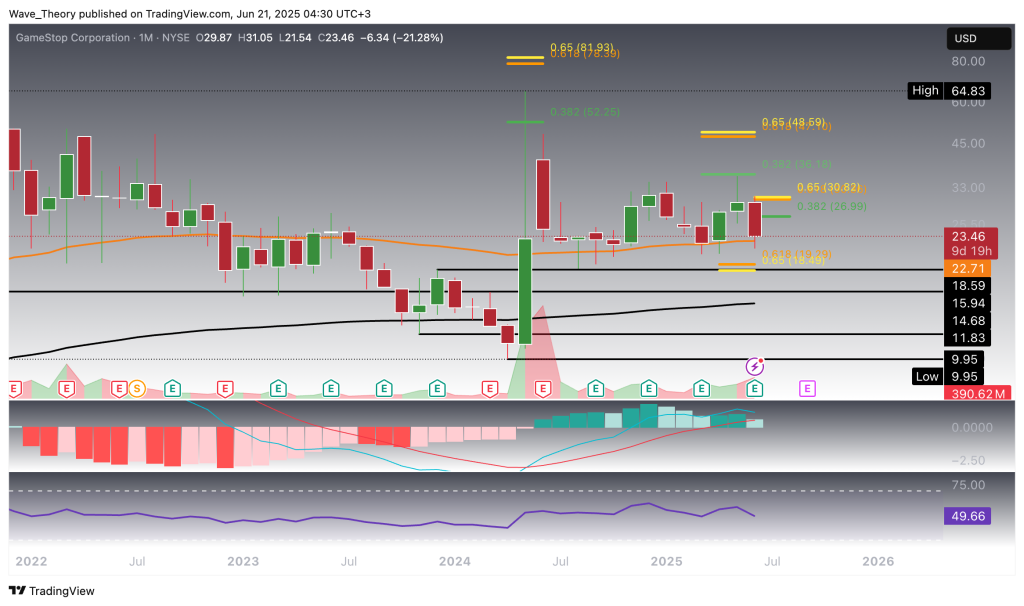
GameStop (GME): Mixed Outlook on the Monthly Chart
On the monthly chart, GameStop (GME) presents a mixed technical outlook, with signals pointing in both directions. The MACD histogram has begun to tick lower this month, indicating a potential loss of bullish momentum, while the MACD lines are on the verge of a bearish crossover, which would reinforce a shift in trend. At the same time, the RSI remains in neutral territory, offering no strong directional bias.
Despite weakening momentum, the long-term trend remains intact, as the EMAs continue to display a golden crossover, confirming a bullish structure on the macro timeframe. Crucially, GME is still trading above the 50-month EMA at $22.70, a key level that has acted as reliable support over the past year.
As long as GME holds above this support, the technical setup allows for a potential move toward the next significant Fibonacci resistance levels at $27.00 and $30.50. However, a sustained breakdown below the 50-month EMA would invalidate this bullish bias and open the door for deeper downside.
- Check out our free forex signals
- Follow the top economic events on FX Leaders economic calendar
- Trade better, discover more Forex Trading Strategies
- Open a FREE Trading Account
- Read our latest reviews on: Avatrade, Exness, HFM and XM
ABOUT THE AUTHOR
See More
Konstantin Kaiser
Financial Writer and Market Analyst
Konstantin Kaiser comes from a data science background and has significant experience in quantitative trading. His interest in technology took a notable turn in 2013 when he discovered Bitcoin and was instantly intrigued by the potential of this disruptive technology.
Related Articles


Sidebar rates
Related Posts
