Bitcoin Poised for Historic Monthly Close Above $109K as Bulls Maintain Control Despite Bear Trap Formation
Bitcoin (BTC) is trading above $108,000, marking a 1.3% gain in the past 24 hours and an impressive 7.3% weekly surge, positioning BTC/USD
Quick overview
- Bitcoin (BTC) is currently trading above $108,000, reflecting a 1.3% gain in 24 hours and a 7.3% increase over the week.
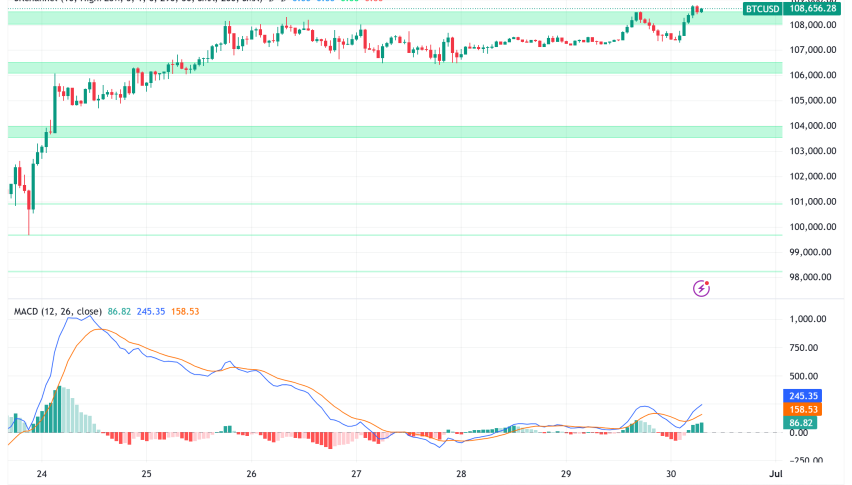
- Technical indicators suggest a bullish market structure, with the MACD showing a golden cross, indicating strong upward momentum.
- Institutional interest remains robust, with over $2 billion in net inflows for Bitcoin spot ETFs in the past week.
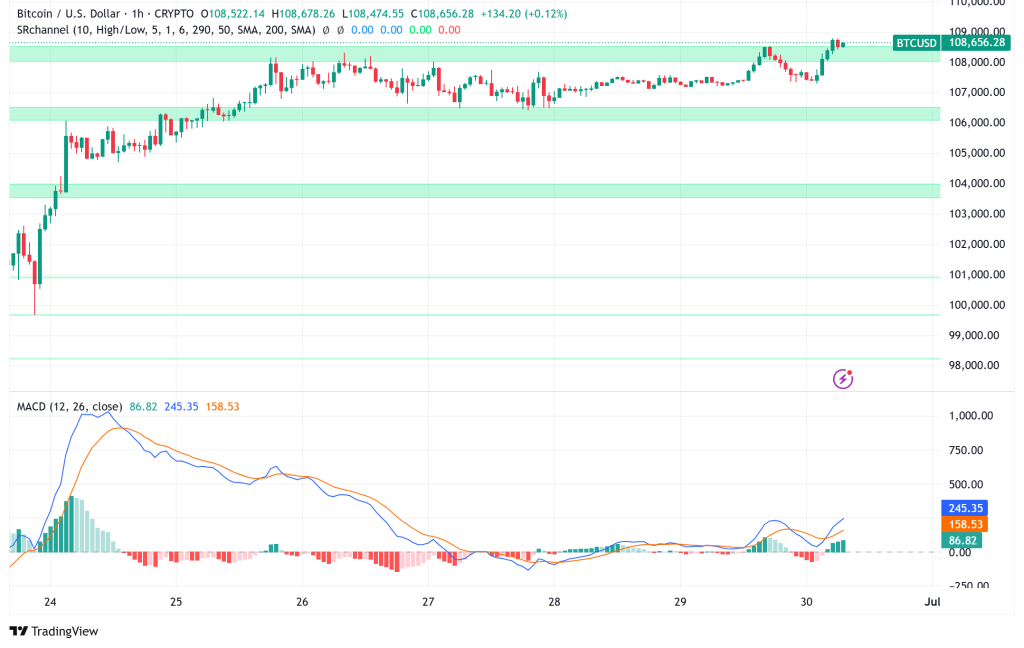
- If Bitcoin can close above $109,000, it may target new resistance levels between $115,000 and $120,000, while support must hold above $106,000 to avoid potential liquidations.
Bitcoin (BTC) is trading above $108,000, marking a 1.3% gain in the past 24 hours and an impressive 7.3% weekly surge, positioning BTC/USD for what could very well be its highest monthly close in history. The world’s largest cryptocurrency by market capitalization is currently testing important resistance levels that could determine its trajectory into Q3 2025.
BTC/USD Technical Analysis: Bullish Market Structure Despite Liquidation Risks
Even though there was a lot of volatility over the weekend because of whale trading, technical indicators are showing that Bitcoin is becoming more optimistic. Autumn Riley, a well-known trader, says that the 15-minute chart shows a strong bullish structure. She says, “Every time price sweeps a high, it reacts down but keeps making higher lows,” which means that selling pressure is slowly going away.
The Moving Average Convergence/Divergence (MACD) indicator has made a golden cross on Bitcoin’s daily chart. This is a classic bullish sign that means the price is moving faster than it has in the past. BitBull, an analyst, said that this change shows that “bulls are in control” of the current market structure.
On the other hand, the market is in a tricky situation because there are big liquidation zones on both sides of the current price range. The Liquidity Zone indicator from analytics company Alphractal shows that short positions have been on the rise over the previous seven days. This has caused a negative Net Delta, which means that bears are taking the lead in starting new positions. If Bitcoin breaks above important resistance levels, this bearish positioning, along with the fact that Bitcoin’s price has been stable, might lead to a short squeeze.
Key Price Levels Point to BTC’s Historic Breakout Potential
Rekt Capital, an analyst, says that the $109,000 barrier is very important for Bitcoin’s next big move. This is the highest weekly closing in the history of the cryptocurrency. Rekt Capital says that if Bitcoin breaks over this level, it would not only be a historic event, but it may also “enable Bitcoin to enjoy a new uptrend into new All Time Highs.”
The way the market is set up right now, there are liquidation clusters emerging on the downside between $103,400 and $106,000 and on the upside between $108,000 and $111,000. KillaXBT’s research shows that Bitcoin is stuck in a “stalemate” between these liquidation zones. The 30-day chart shows that more short-side liquidations are happening in the higher range, which might be good for bullish outcomes.
James Wynn, a well-known Hyperliquid trader, made weekend trading even more volatile by opening a $13.9 million short position and then rapidly closing it and going long with about 60 BTC. Whale activity like this on weekends with minimal liquidity shows how sensitive the market is to big changes in positions.
Institutional Confidence Remains Strong Despite Market Consolidation
There has been a lot of institutional interest in Bitcoin spot ETFs, with net inflows of more than $2 billion last week alone. This is the third week in a row of good news, and over the past three weeks, total deposits have reached $4.63 billion. BlackRock’s IBIT brought in the most money, with $1.31 billion in net deposits. Fidelity’s FBTC and Ark/21 Shares’ ARKB added $504.40 million and $268.14 million, respectively.
Even though Bitcoin has been stuck in a $100,000-$110,000 range since it achieved its all-time high of $111,790 on May 22, institutions are still interested in it. Investors moving $310 million out of exchanges shows that they are confident in the market, since they are putting their assets in private wallets, which usually means they plan to hold them for a long time.
Bitcoin Price Prediction: Bullish Momentum Targets $115K-$120K Range
According to current technical analysis and how the market is moving, Bitcoin looks like it’s about to break out in a positive way. There is a good chance that prices will reach new all-time highs because of positive technical indications, possible short squeeze conditions, and strong institutional demand.
If Bitcoin can close over $109,000 this week, the next big resistance levels would be between $115,000 and $120,000, which would be a possible 15–20% increase from where it is now. But if support doesn’t stay above $106,000, extended liquidations could happen, which would push prices down to the $103,000–$104,000 range.
If the cryptocurrency can close over $109,000 on a weekly or monthly basis, it will probably start the third quarter of 2025 with renewed positive momentum or continued consolidation inside the present trading range.
- Check out our free forex signals
- Follow the top economic events on FX Leaders economic calendar
- Trade better, discover more Forex Trading Strategies
- Open a FREE Trading Account
- Read our latest reviews on: Avatrade, Exness, HFM and XM
Related Articles


Sidebar rates
Related Posts
