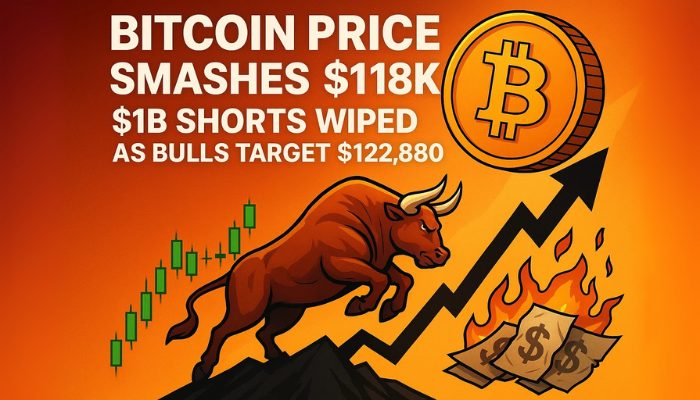
Bitcoin Price Smashes $118K: $1B Shorts Wiped as Bulls Target $122,880
Bitcoin isn’t just making headlines—it’s making history. Today BTC surged past $118,800, a new all-time high and 4% in 24 hours.
Quick overview
- Bitcoin has reached a new all-time high of $118,800, marking a 4% increase in just 24 hours.
- The surge triggered $1.04 billion in liquidations across the crypto market, with $570 million in Bitcoin shorts wiped out.
- US spot Bitcoin ETFs have seen $50 billion in net inflows this week, indicating strong institutional confidence.
- Technical indicators suggest that Bitcoin could target $122,880 if it maintains momentum above the 1.618 Fibonacci level.
Bitcoin isn’t just making headlines—it’s making history. Today BTC surged past $118,800, a new all-time high and 4% in 24 hours. This breakout triggered a liquidation wave, $1.04B across the crypto market. Shorts got wiped out, $570M in Bitcoin shorts and $415M of that in 1 hour according to Coinglass.
The rally was driven by derivatives. Glassnode shows a strong CVD (Futures Cumulative Volume Delta) — a sign that traders were going long aggressively even as funding rates were low. That’s confident futures-driven momentum without too much leverage.
- $1.04B total crypto liquidations
- $570M in BTC shorts
- $415M in 60 minutes
- 707K BTC open interest ($82B)
With open interest at 707,000 BTC ($82B) analysts are warning that any derivative shakeout will bring volatility. But for now the bulls are in control.
Spot Volume Slow, ETFs Keep Climbing
Spot buying is quiet but ETFs are getting busy. According to SoSoValue, US spot Bitcoin ETFs have seen $50B in net inflows this week. BlackRock’s IBIT now manages $77B in assets, one of the fastest growing ETFs in history.
It took the largest gold ETF 15 years to hit that milestone.
IBIT holds over 700,000 BTC, 81% of the Bitcoin held by public companies. That’s institutional confidence and long term accumulation behind the volatility.
Bitcoin Outlook: Bulls Target $122,880 in Fibonacci Surge
The technicals are as strong as the fundamentals. After breaking above the 1.414 Fibonacci extension at $115,653 BTC is now testing the 1.618 at $118,169. Close above this and we could see a new wave to the 2.0 extension at $122,880 and the 2.272 at $126,237 soon after.
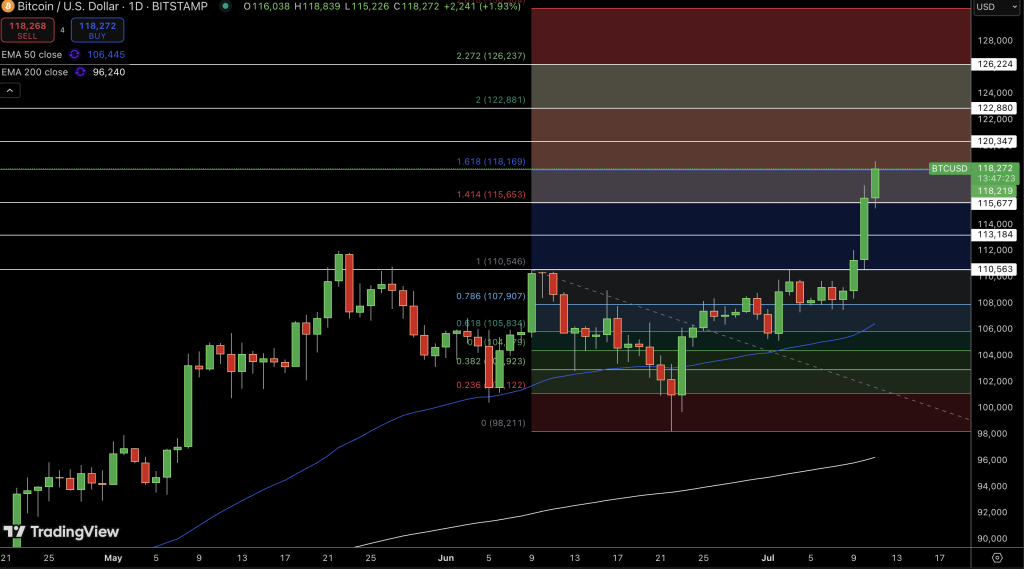
The daily chart looks strong:
- Higher lows and bullish engulfing candles* Price bouncing off 50-EMA ($106,443)
- RSI not overbought
- No bearish divergence or reversal patterns
Trade Setup (Fibonacci Breakout):
- Entry: Daily close above $118,200
- Stop-Loss: Below $115,600
- Targets: $120,347 and $122,880
In my experience, breakouts above 1.618 Fib levels attract momentum traders who ride the wave to 2.0. Watch for Doji candles or fading volume as signs of exhaustion—but for now the bulls have a lot of room to run.
- Check out our free forex signals
- Follow the top economic events on FX Leaders economic calendar
- Trade better, discover more Forex Trading Strategies
- Open a FREE Trading Account
- Read our latest reviews on: Avatrade, Exness, HFM and XM
Related Articles

Sidebar rates
Related Posts
