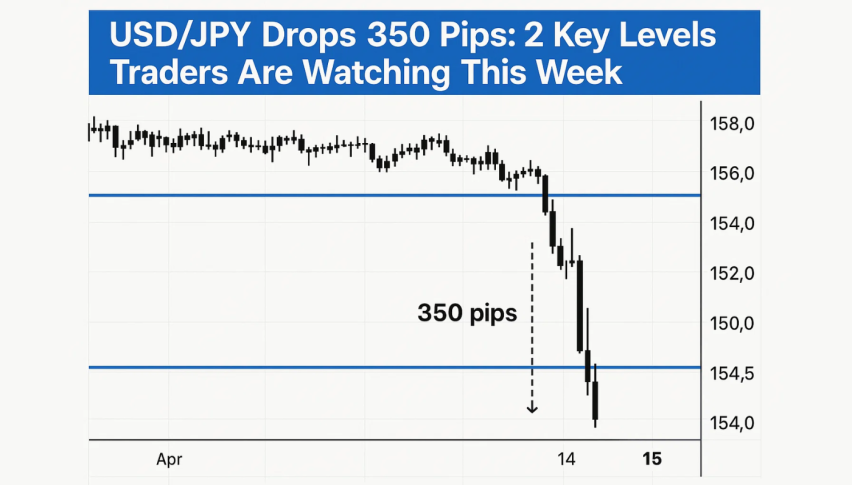
USD/JPY Drops 350 Pips: 2 Key Levels Traders Are Watching This Week
The Japanese Yen struggled to find footing on Monday, extending last week’s decline against the US Dollar...
Quick overview
- The Japanese Yen continued to decline against the US Dollar, trading near 147.75 after a significant drop from 151.00.
- BoJ Governor Kazuo Ueda downplayed inflation concerns and indicated that rate hikes may be delayed, putting further pressure on the Yen.
- Disappointing US labor data led to increased speculation of a Fed rate cut, contributing to the dollar's decline.
- Technically, USD/JPY is testing support at 147.17, with potential buying opportunities if bullish patterns emerge.
The Japanese Yen struggled to find footing on Monday, extending last week’s decline against the US Dollar. USD/JPY traded near 147.75 after plunging over 350 pips from the recent 151.00 high. This sharp correction came after disappointing US jobs data and a more dovish than expected Bank of Japan tone which sparked volatility across the board.
BoJ Governor Kazuo Ueda recently dismissed inflation concerns and offered little conviction on rate hikes. Despite an upward revision to inflation forecasts, Ueda said wait and see. With the ruling Liberal Democratic Party’s political setback in July, markets now expect BoJ tightening to be delayed and the Yen to stay under pressure.
Fed Cut Bets Accelerate After NFP Miss
On the US side, soft labor data fueled rate cut speculation. July Nonfarm Payrolls showed only 73K new jobs – well below 110K expected. Even more concerning, previous months were revised down: May’s gain was slashed to 19K and June’s to 14K.
Unemployment rate ticked up to 4.2% while average hourly earnings rose to 3.9%. Markets quickly priced in 80% chance of a September Fed rate cut. With Fed Governor Adriana Kugler’s early resignation and the resulting decline in US Treasury yields, the dollar fell and USD/JPY plummeted.
USD/JPY Technical Setup and Trade Idea
From a technical standpoint, USD/JPY bounced off the trendline support at 147.17 which has held since early July. While the pair tries to recover, sellers are capping gains below the 50-period SMA at 148.95 and the 38.2% Fib at 148.57. A series of spinning tops and dojis indicate indecision not conviction.
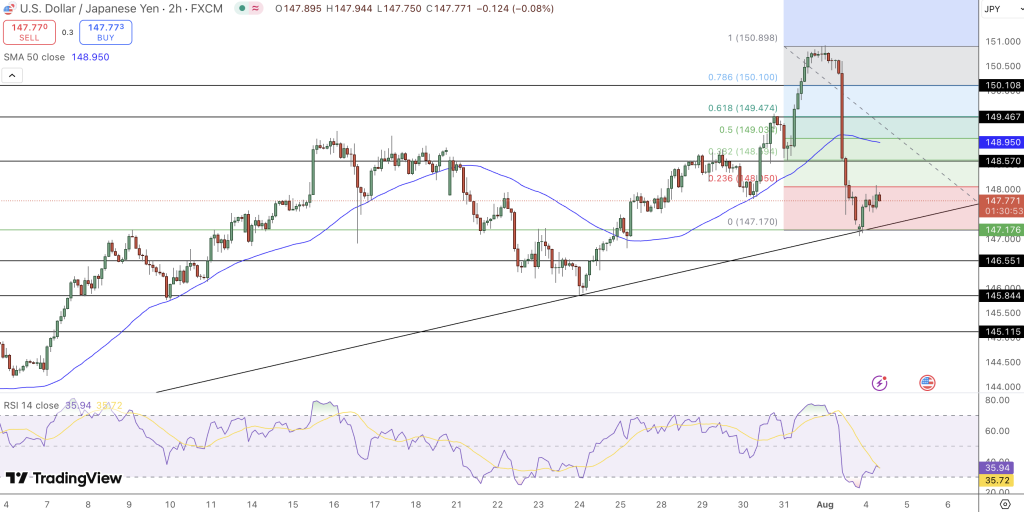
RSI at 35.8 is oversold but bullish divergence hasn’t been confirmed. If price retests 147.17 and forms a bullish engulfing or hammer candle, traders can look to buy the pair with targets at 148.57 and 149.03. Stop below 146.55.
- Resistance levels: 148.57, 149.03, 149.47
- Support levels: 147.17, 146.55, 145.84But below 147.17 and the bullish setup is broken. Watch volume, RSI and overall market mood before US factory orders and BoJ minutes on Tuesday.
- Check out our free forex signals
- Follow the top economic events on FX Leaders economic calendar
- Trade better, discover more Forex Trading Strategies
- Open a FREE Trading Account
- Read our latest reviews on: Avatrade, Exness, HFM and XM
Related Articles


Sidebar rates
Related Posts
