Sui Drops Below $3.50 as Bearish Bets Hit One-Month High on Weak Momentum
SUI is under pressure, below $3.50 as of Thursday after closing below the trendline last week. This technical breakdown...
Quick overview
- SUI is currently under pressure, trading below $3.50 after a recent technical breakdown.
- The long-to-short ratio for SUI is at 0.63, indicating bearish dominance among traders.
- Technical indicators show weakness, with RSI below 50 and MACD in a bearish crossover.
- A close below $3.35 could lead to a deeper correction, while breaking above $3.65 may provide a short-term bounce.
SUI is under pressure, below $3.50 as of Thursday after closing below the trendline last week. This technical breakdown, combined with bearish signals from on-chain and derivatives data, means more downside risk for the Layer 1 token.
CoinGlass shows SUI’s long-to-short ratio at 0.63, the lowest in over a month. A ratio below 1 means bearish dominance with more traders shorting to sell into the fall. This metric indicates more skepticism on SUI’s short term.
CryptoQuant’s Taker CVD (which measures the difference between market buy and sell volumes over time) has turned negative and is still declining. This means sellers are in control and we’re in a Taker Sell Dominant Phase since mid-July. On-chain metrics confirm a deeper correction in the short term.
SUI Technicals Show Weakness
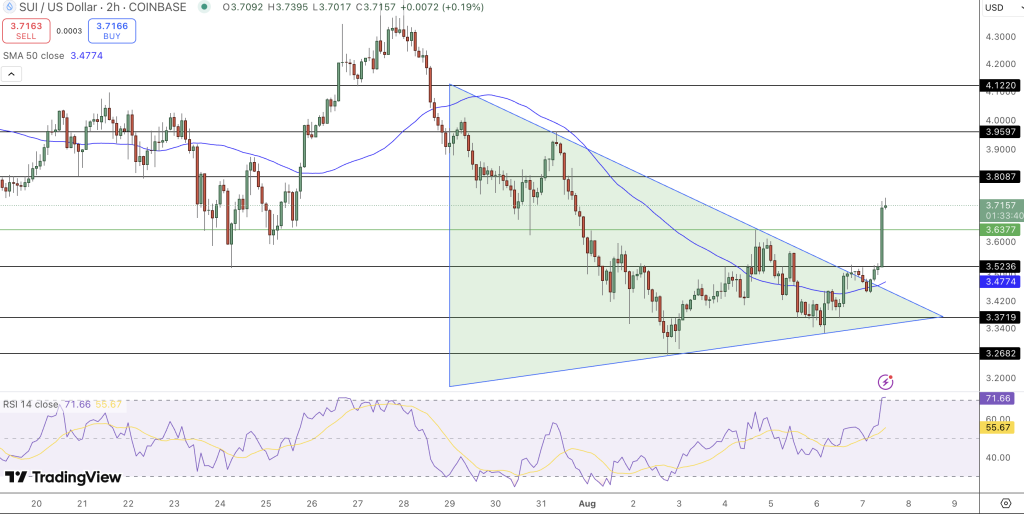
SUI’s price action is getting more volatile and weaker. After closing below the trendline on Friday, it fell 4% and although it bounced from the 200 day EMA at $3.35 on Sunday, it failed to close above the broken trendline.
That trendline now overlaps with the resistance at $3.65 which is also the 61.8% Fibonacci retracement at $3.62. SUI has retested this zone twice and failed to close above. Now it’s stuck at $3.50 with no conviction.
Key technicals show bearishness:
- RSI below 50, no buying pressure
- AO below zero, downward momentum
- MACD bearish crossover from July 29 still active
SUI Outlook: Deeper Pullback Likely
If SUI closes below the 200 day EMA at $3.35 it could accelerate down to the next daily support at $2.90. This would confirm the bearish scenario.
But if it breaks above $3.65 it would invalidate the bearish scenario and open the path to $4.44.
Watch for:
- Close below $3.35 = deeper correction
- Above $3.65 = short term bounce
Summary:
Sui’s bearish technical and sentiment signals suggest a vulnerable outlook. Traders remain cautious as downside risks mount, especially if $3.35 support fails.
- Check out our free forex signals
- Follow the top economic events on FX Leaders economic calendar
- Trade better, discover more Forex Trading Strategies
- Open a FREE Trading Account
- Read our latest reviews on: Avatrade, Exness, HFM and XM
Related Articles


Sidebar rates
Related Posts
