Apple (AAPL) Stock Analysis 2025: Key Support and Resistance Levels To Watch

Quick overview
- Apple stock has rebounded over 30.5% after a 35% decline, indicating renewed investor confidence.
- The stock faces critical resistance at the golden ratio level of $228, with a potential upside toward the all-time high of $260 if broken.
- Despite bullish momentum on the weekly chart, short-term bearish signals on the daily chart suggest caution is warranted.
- Key support levels include $198 and the significant zone between $164 and $171, which held during the prior decline.
After a sharp 35% decline from December 2024 to April 2025, Apple stock (AAPL) has staged a robust recovery, gaining over 30.5% since then—signaling renewed investor confidence and potential for further upside.
Apple Stock Bounces Off Critical Support, Eyes Golden Ratio Resistance
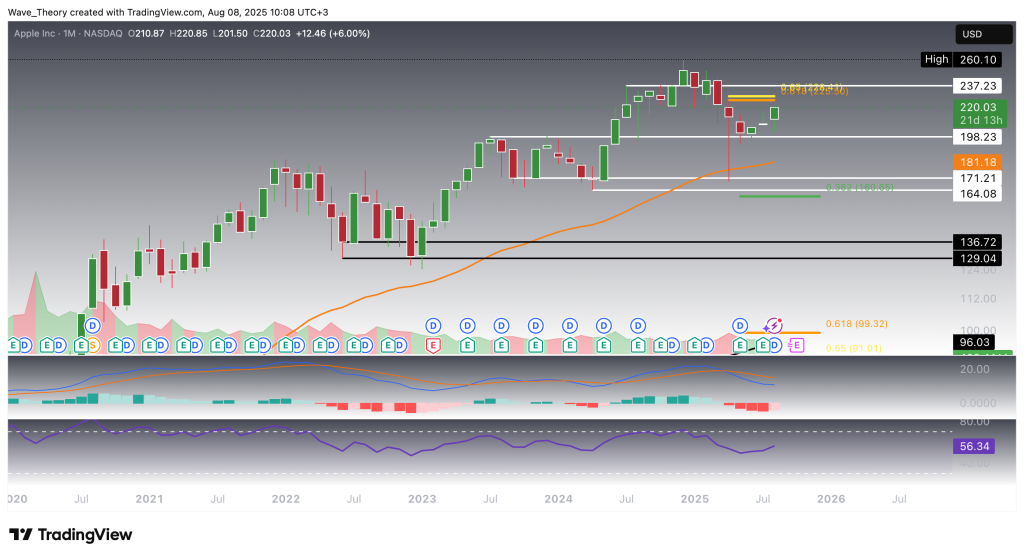
Apple (AAPL) experienced a notable decline from its all-time high near $260 down to a crucial support zone between $164 and $171, where the stock found strong buying interest and bounced sharply. Importantly, deeper Fibonacci supports at $160 and $100 remained untested during this move. Following this rebound, Apple rallied swiftly from approximately $170 to $198 within the same month, maintaining solid footing above that support area. Correspondingly, the MACD histogram has begun to tick higher this month, signaling growing bullish momentum.
Currently, Apple confronts a significant golden ratio resistance level at $228. A decisive break above this barrier could pave the way for a retest of the all-time high at $260—or potentially a new peak beyond it. However, caution remains warranted as the MACD lines are still bearishly crossed, and the RSI hovers in neutral territory, indicating that momentum is not yet fully resolved.
Mostly Bullish Signals on the Weekly Chart
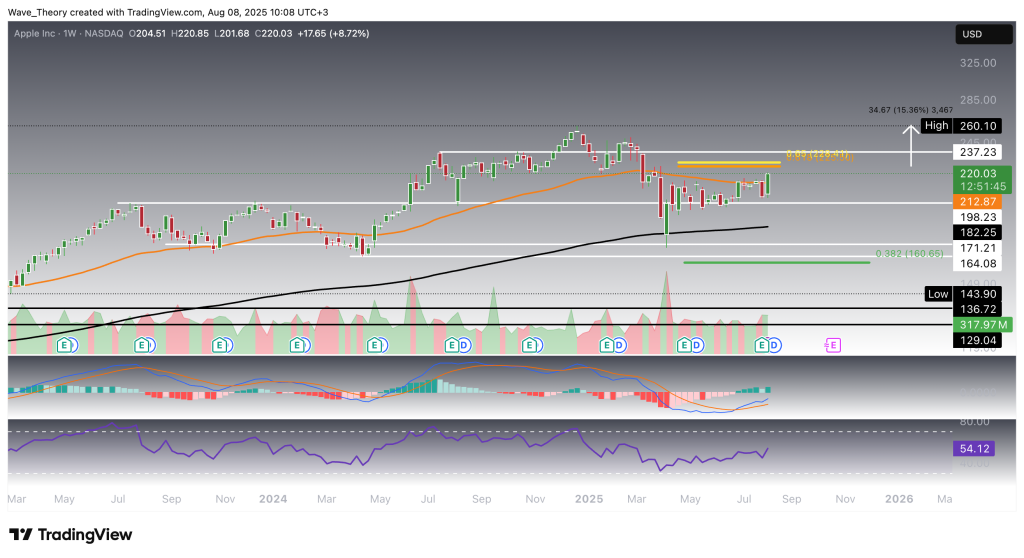
Apple faces critical resistance at the 50-week EMA near $213, which must be cleared before a successful challenge of the golden ratio level at $228. A break above $228 would imply upside potential of approximately 15.4%.
Notably, Apple has encountered rejection at the 50-week EMA for the past five weeks, reflecting some near-term selling pressure. However, the technical backdrop remains largely constructive. The MACD lines remain bullishly crossed, and the MACD histogram has begun ticking higher this week after closing lower last week. Additionally, the EMAs maintain a golden crossover, confirming a bullish trend in the mid-term. The RSI sits in neutral territory, offering no immediate overbought or oversold signals.
Death Cross Forms on Apple’s Daily Chart Amid Mixed Signals
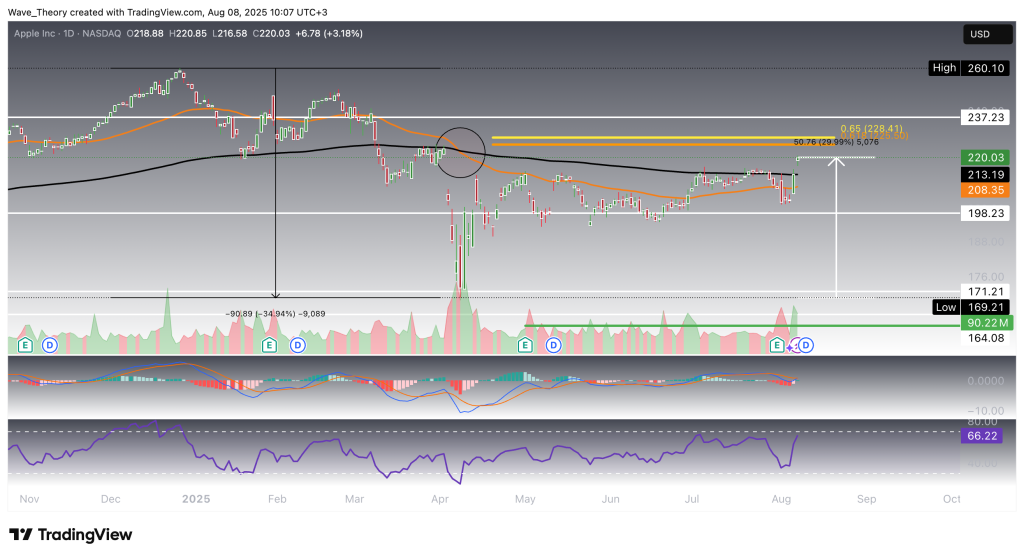
On the daily timeframe, Apple’s EMAs have formed a death cross, signaling a bearish trend in the short- to medium-term. Supporting this, the MACD lines are bearishly crossed, and the MACD histogram has been trending lower for most of the week. Meanwhile, the RSI remains neutral, offering no clear bullish or bearish signals at this time.
On a more positive note, Apple appears to have successfully broken above the 200-day EMA near $213, potentially clearing the path toward the golden ratio resistance at $228.
Apple Stock 4H Chart: Golden Crossover Approaching
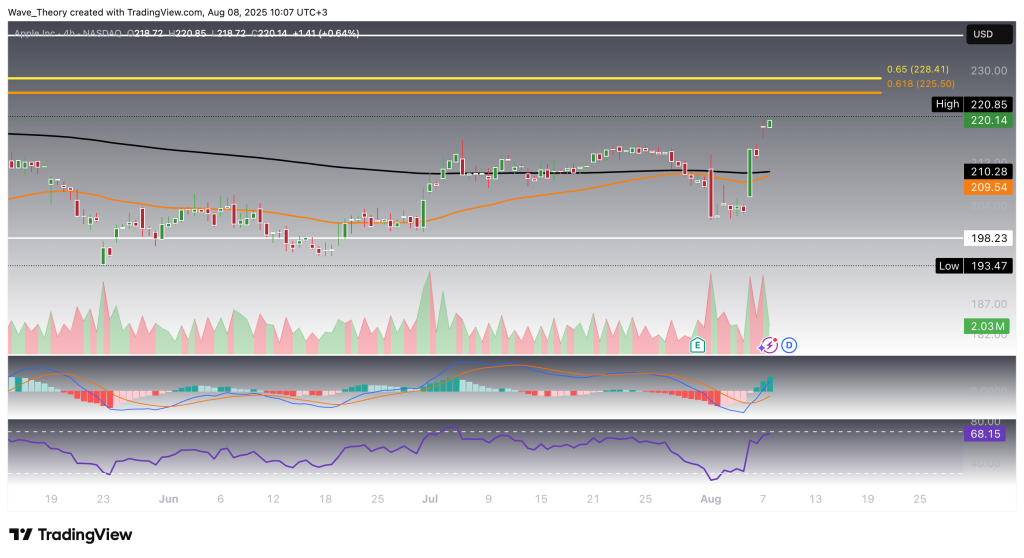
On the 4-hour chart, the MACD lines are bullishly crossed, accompanied by a rising MACD histogram signaling strengthening momentum. Additionally, the EMAs are on the verge of a bullish crossover, which, once formed, would confirm a short-term bullish trend. Meanwhile, the RSI is approaching overbought levels but has yet to emit any bearish signals.
Apple (AAPL) Technical Summary & Key Levels
Apple has rebounded strongly from the support zone between $164 and $171, recovering to hold above $198. The stock now faces critical resistance at the golden ratio level of $228, with a successful break signaling potential upside toward the all-time high near $260.
Key Resistance Levels:
-
$213 — 50-week and 200-day EMA resistance
-
$228 — Golden ratio resistance, a pivotal breakout point
-
$260 — All-time high target
Key Support Levels:
-
$198 — Recent support following the rebound
-
$171–$164 — Significant support zone that held the prior decline
Momentum remains mostly bullish across weekly and short-term charts, with golden crossovers forming and MACD histograms trending upward. However, some short-term bearish signals on the daily chart and RSI approaching overbought levels warrant cautious monitoring.
- Check out our free forex signals
- Follow the top economic events on FX Leaders economic calendar
- Trade better, discover more Forex Trading Strategies
- Open a FREE Trading Account
- Read our latest reviews on: Avatrade, Exness, HFM and XM
Related Articles


Sidebar rates
Related Posts
