AUD/USD at $0.6505: 3 Technical Signals Traders Can’t Ignore
The Australian dollar started the week steady, with AUD/USD holding around $0.6505 during Monday’s European session.
Quick overview
- The Australian dollar remains steady around $0.6505 as traders await a significant meeting between Donald Trump and Ukrainian President Zelenskyy.
- Expectations of a rate cut by the Fed are weakening the US dollar, with a 95% chance of a 25bps cut priced in for September.
- AUD/USD is coiling in a symmetrical triangle, indicating a potential breakout, with immediate support at $0.6485 and resistance at $0.6558.
- Traders should look for confirmation candles to avoid false signals as the market remains cautious amid geopolitical tensions.
The Australian dollar started the week steady, with AUD/USD holding around $0.6505 during Monday’s European session. Traders are cautious ahead of the big White House meeting between former US President Donald Trump and Ukrainian President Volodymyr Zelenskyy. Markets expect nothing to come out of it but if something unexpected happens it will change risk sentiment.
On Truth Social, Trump said Ukraine can end the war quickly if they abandon their NATO ambitions and claims to Crimea. Zelenskyy has rejected that outright. While we watch closely, the market has already priced in the war so any reaction will be muted unless something new happens.
Fed Outlook Weakens the Dollar
Beyond geopolitics, the US dollar is weakening under rate cut expectations. The US Dollar Index (DXY) is near a 3 week low at 97.70. Traders are now pricing in a 95% chance of a 25bps cut at the Fed’s September meeting according to CME’s FedWatch Tool.
This dovish outlook has boosted demand for higher yielding currencies like the Australian dollar. With investors also waiting for Fed Chair Jerome Powell’s speech at the Jackson Hole Symposium (Aug 21-23), AUD/USD will be sensitive to monetary policy cues.
AUD/USD Faces Key Test
From a technical perspective, AUD/USD is coiling in a symmetrical triangle, often a precursor to a breakout. Price is stuck at the 50 period SMA at $0.6521 but can’t get above it. Candlestick action shows hesitation, with a series of spinning tops – small bodied candles with long wicks – reflecting a tug of war between bulls and bears.
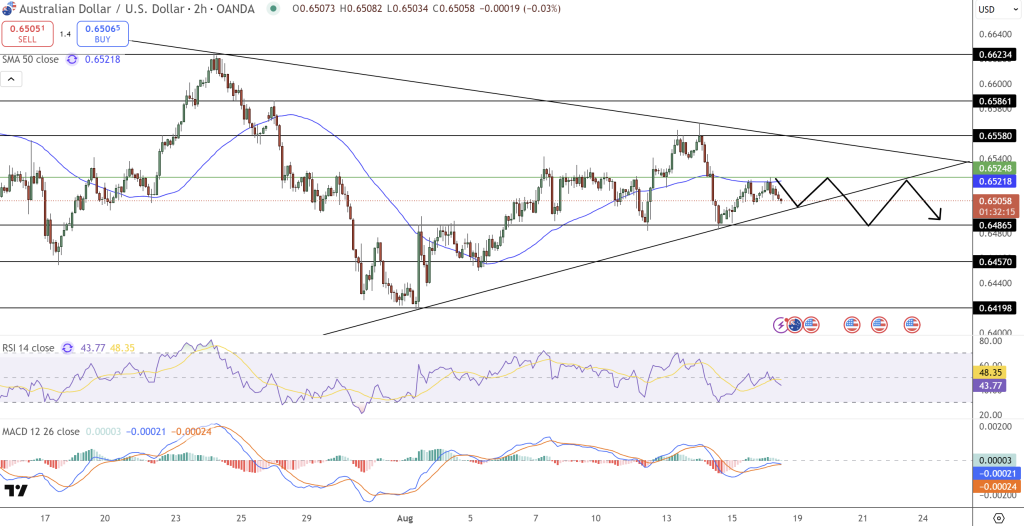
Momentum indicators are bearish. The RSI is at 43, below the 50 level, and the MACD lines are crossing down, both showing waning bullish momentum.
- Immediate support: $0.6485, then $0.6457.
- Deeper support: $0.6420 if it breaks.
- Resistance: $0.6558 (triangle ceiling), $0.6586, $0.6623 on extension.
For traders, it’s simple:
- Bearish: Short below $0.6485, stop above $0.6558, target $0.6457-$0.6420.
- Bullish: Long above $0.6558, up to $0.6586-$0.6623.
This triangle means the longer AUD/USD trades sideways the bigger the breakout will be. Look for confirmation candles (engulfing patterns or dojis) to avoid false signals.
- Check out our free forex signals
- Follow the top economic events on FX Leaders economic calendar
- Trade better, discover more Forex Trading Strategies
- Open a FREE Trading Account
- Read our latest reviews on: Avatrade, Exness, HFM and XM
Related Articles


Sidebar rates
Related Posts
