AMC Entertainment (AMC) Drops 32% Amid Bearish Momentum

Quick overview
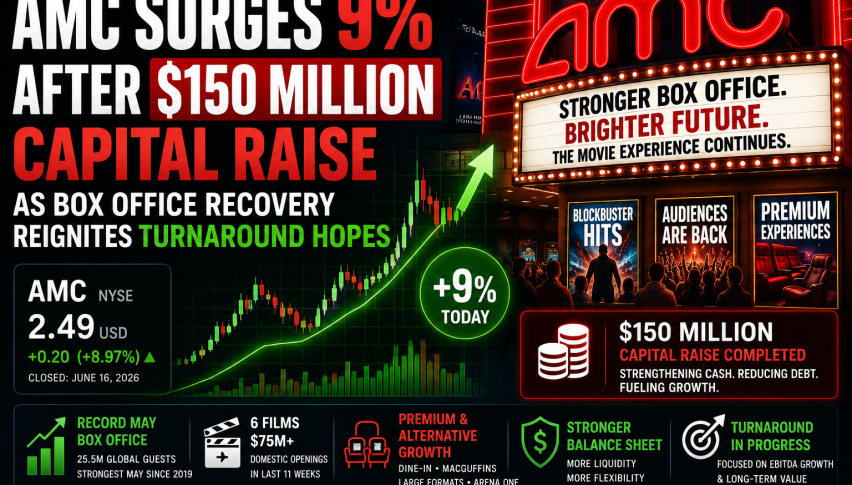
- AMC stock has surged over 31% in the past four months, but recent bearish sentiment has emerged among traders.
- After a strong rally in May, AMC stock has retraced approximately 32%, approaching critical support levels near its all-time low.
- Technical indicators suggest caution, with the MACD showing declining momentum and the RSI remaining neutral.
- A break below $2.95 could lead to further downside, while holding above this level may allow for a potential recovery.
AMC stock has surged over 31% in the past four months, reigniting bearish sentiment among retail traders and speculators. The key question now: can this momentum bring the AMC stock price below its all-time-low?
AMC Stock Retraces Sharplyhttps://www.fxleaders.com/news/2025/08/20/amc-entertainmen…bearish-momentum/, Testing Key Support Levels
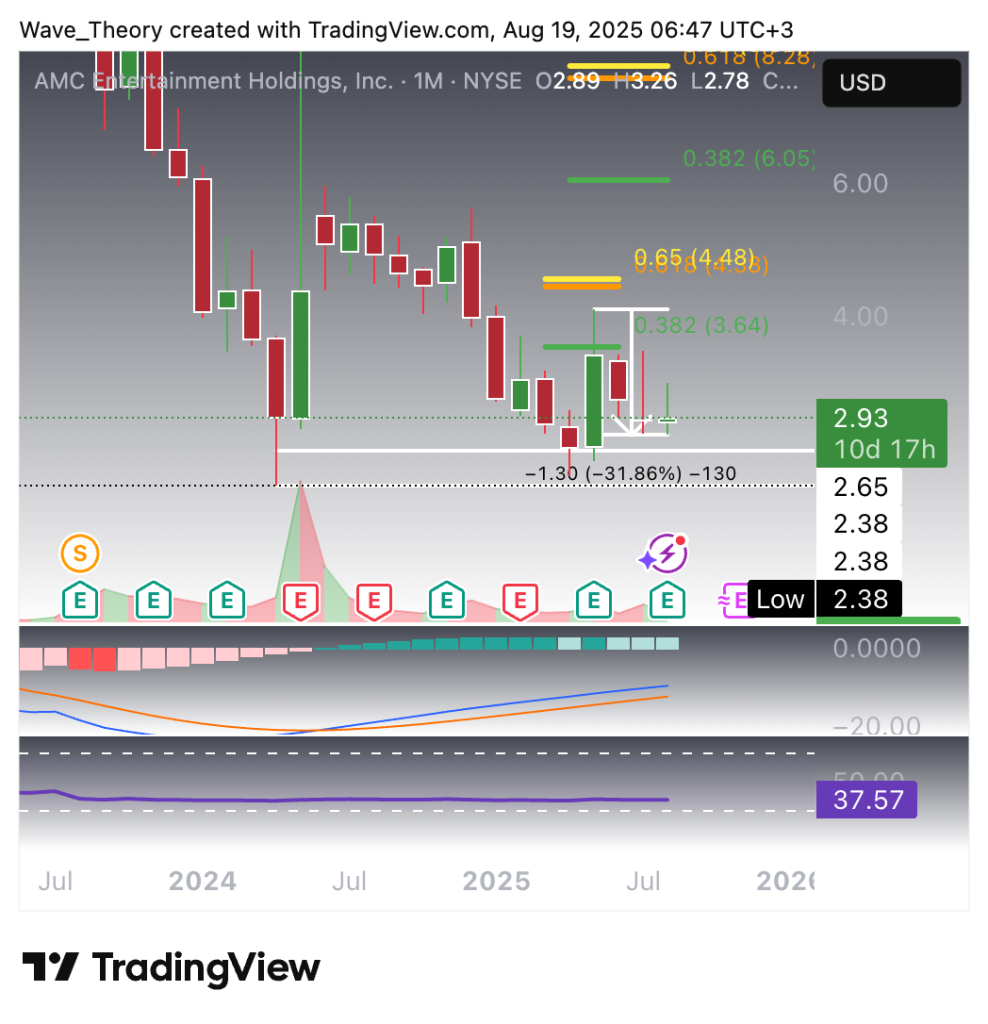
Following a highly bullish May, during which AMC stock rallied nearly 60%, the stock has since retraced approximately 32% after failing to sustain above the 0.382 Fibonacci resistance level at $3.64. The recent decline brings AMC toward a critical support zone, defined by the all-time low at $2.38 and the previous swing low close at $2.65.
On the monthly chart, momentum indicators are signaling caution: the MACD histogram has been declining over the past three months, indicating waning upward momentum, although the MACD lines themselves remain in a bullish crossover configuration. Meanwhile, the RSI sits in neutral territory, suggesting neither overbought nor oversold conditions at this juncture.
From a risk/reward perspective, a break below $2.38 would confirm a deeper downside continuation, whereas a sustained hold above $2.65–$2.38 could offer a measured recovery target back toward $3.20–$3.64, aligning with prior Fibonacci resistance and swing highs.
AMC Entertainment Holdings Inc. Faced Rejection Twice
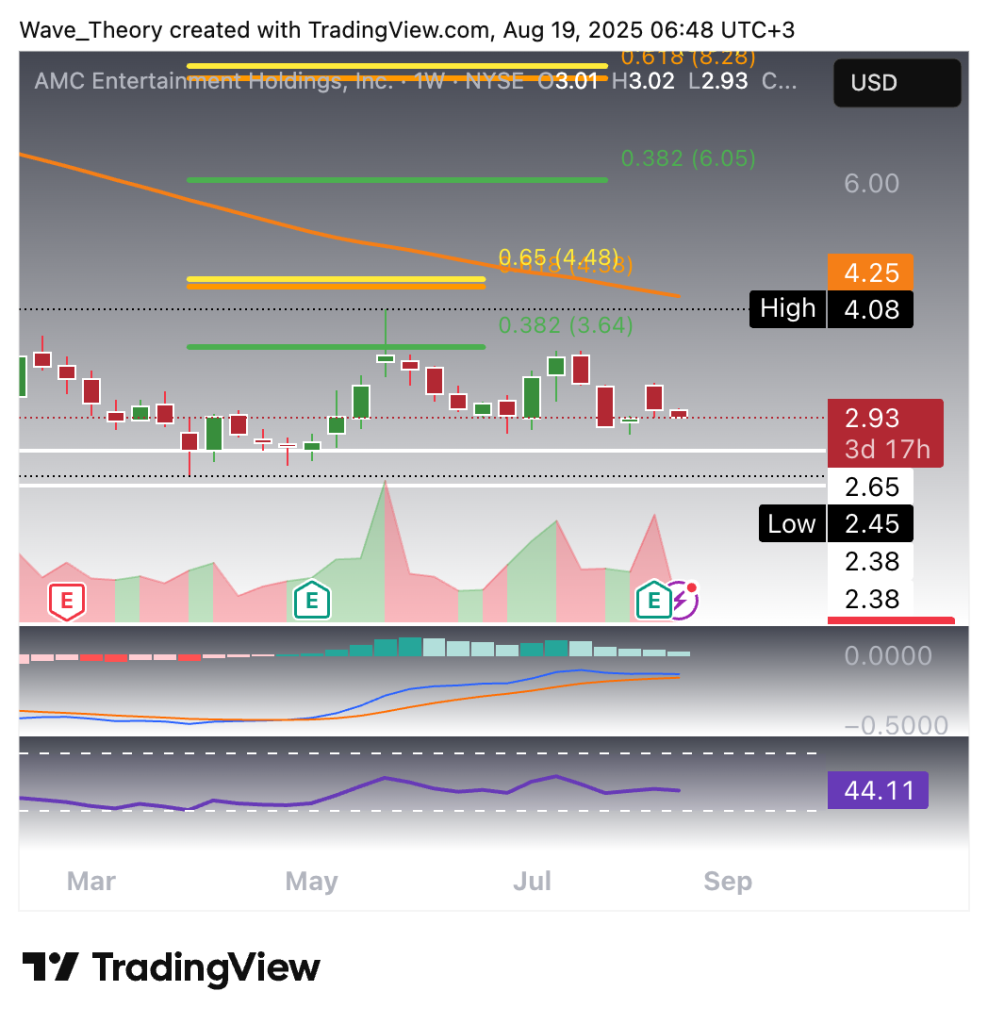
AMC stock has tested the 0.382 Fibonacci retracement level at $3.64 twice but failed to break above it, signaling strong resistance. Over the past five weeks, the MACD histogram has been trending lower, indicating waning bullish momentum, and the MACD lines are approaching a bearish crossover, suggesting potential downside pressure if confirmed.
Meanwhile, the RSI remains in neutral territory, reflecting neither overbought nor oversold conditions, leaving the stock with room for consolidation or a technical pullback.
AMC Stock Tests Critical Golden Ratio Support Amid Bearish Signals
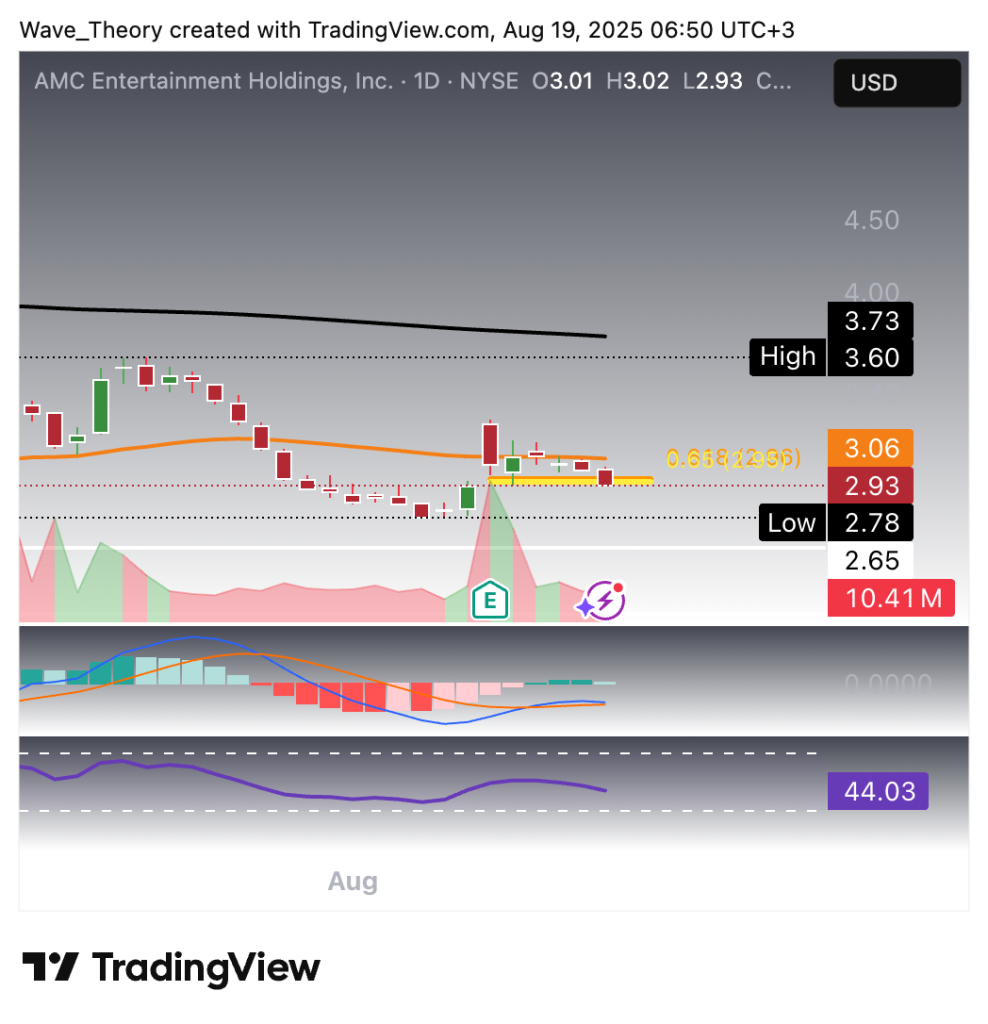
AMC stock has reached the golden ratio support at $2.95, a level that could act as a potential bullish bounce point. However, just two days earlier, the stock encountered rejection at the 50-day EMA at $3.06, which serves as a short-term bearish indicator.
The daily chart displays a death cross in the EMAs, confirming a short- to mid-term bearish trend. Momentum indicators are also signaling caution: the MACD histogram has begun to tick lower today, and the MACD lines may form a bearish crossover if the current trajectory continues. Meanwhile, the RSI remains neutral, providing no clear bullish or bearish bias at this juncture.
From a technical perspective, $2.95 represents a key support zone, with the $3.06 50-day EMA acting as immediate resistance. A sustained break below $2.95 would reinforce the bearish trend, whereas a successful defense of this level could offer a tactical bounce toward $3.06 or higher Fibonacci retracement levels.
AMC Exhibits Bearish Break of Golden Ratio Support
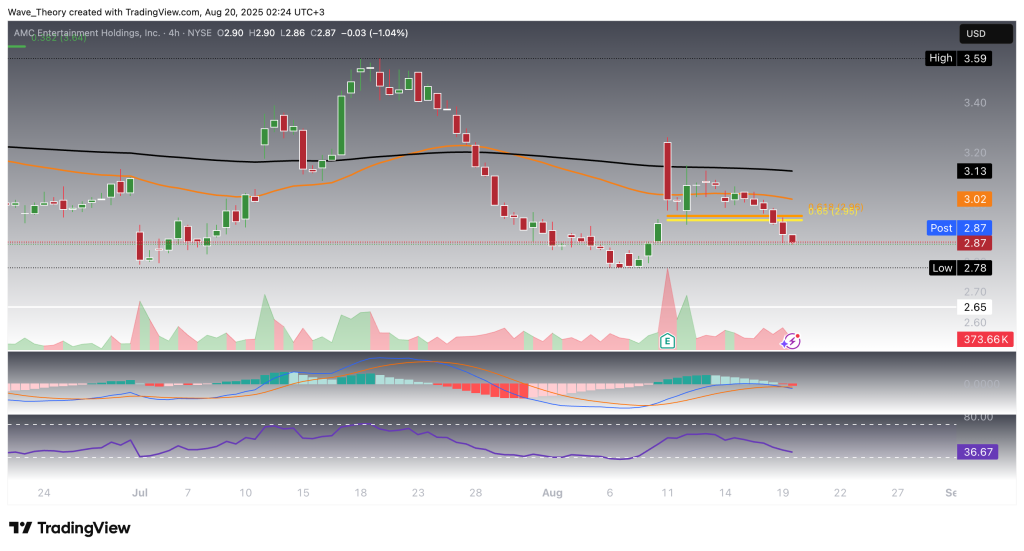
On the 4-hour chart, AMC is currently breaking the golden ratio support at $2.95 on the downside, signaling potential further retracement toward the broader support zone between $2.38 and $2.65. Short-term support is likely to emerge near $2.78.
Technical indicators reinforce the bearish outlook. The EMAs display a death cross, confirming a short-term downtrend. Additionally, the MACD lines have crossed bearishly, and the MACD histogram continues to trend lower. The RSI remains in neutral territory but could approach oversold levels if selling pressure persists.
From a tactical perspective, the $2.95 break increases the probability of a test of $2.78–$2.35, while any recovery above $2.95 would be required to stabilize momentum.
- Check out our free forex signals
- Follow the top economic events on FX Leaders economic calendar
- Trade better, discover more Forex Trading Strategies
- Open a FREE Trading Account
- Read our latest reviews on: Avatrade, Exness, HFM and XM
Related Articles

Sidebar rates
Related Posts
