Gold Price Analysis: $3,336 Support Holds as Traders Await Jackson Hole
Gold is at a crossroads, consolidating within a descending channel and bumping up against a rising trendline...
Quick overview
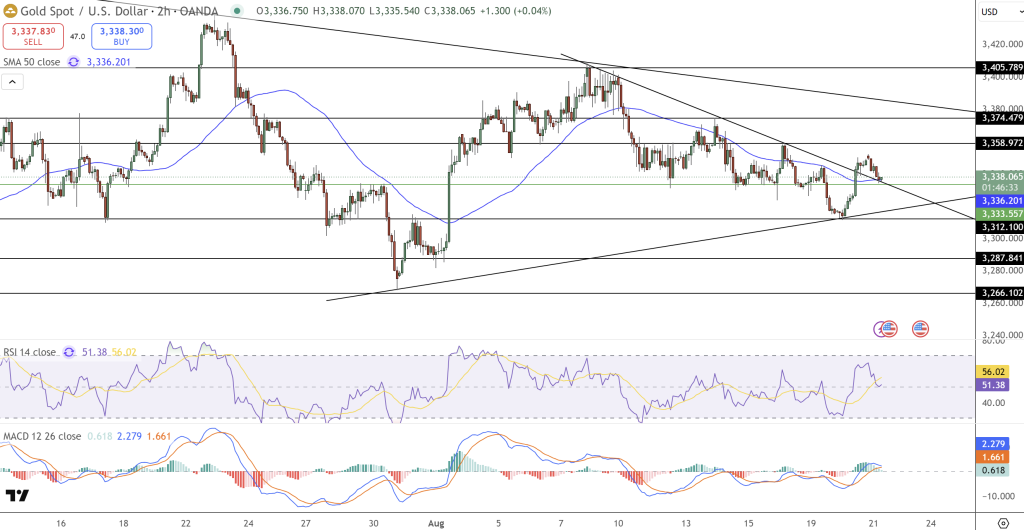
- Gold is consolidating within a descending channel and is currently testing a rising trendline that has provided support since late July.
- Technical indicators show mixed signals, with RSI declining while MACD indicates potential upside momentum.
- Key levels to watch include an upside breakout above $3,358 targeting $3,374 and $3,405, and a downside risk below $3,333 opening up $3,312 and $3,287.
- Traders are advised to define trades around these technical boundaries to minimize the risk of false breakouts.
Gold is at a crossroads, consolidating within a descending channel and bumping up against a rising trendline that has been supporting pullbacks since late July. On the 2 hour chart the 50 period SMA at $3,336 is short term resistance. Recent candles are small and indecisive around this area, as markets wait for Powell’s Jackson Hole comments.
For now the risk is on whether gold breaks above or below resistance. This is market wide caution as traders weigh inflation and central bank signals.
Momentum Signals Mixed
Technicals are split. RSI is 51 down from 56, not oversold but fading momentum. MACD is positive with a fresh bullish crossover and green histogram bars, suggesting upside momentum building.
Gold edged higher on Wednesday as investors await the minutes of the US Federal Reserve’s last policy meeting and the upcoming Jackson Hole symposium.https://t.co/zKZTfdiWEm
— MINING.COM (@mining) August 20, 2025
This RSI weakness/MACD strength divergence often precedes volatility. A clear breakout will confirm which signal is dominant, traders will be watching for confirmation.
Key levels to watch:
- Upside breakout: Above $3,358 targets $3,374 then $3,405.
- Downside risk: Below $3,333 opens $3,312 and $3,287.
These levels will dictate short term sentiment and trading flows.
Gold Trade Ideas for Different Setups
Candlestick patterns add context. A hammer at $3,312 was strong demand and that level is now major support. But the sequence of small candles is a stalling pattern, the market is vulnerable to a big move in either direction.
For novice traders one way to trade this is to define trades around clear technical boundaries:
- Conservative long: Enter on a close above $3,358, stop below $3,333. Targets are $3,374 and $3,405.
- Aggressive short: Enter below $3,333, targets $3,312 and $3,287.
By waiting for confirmation at these levels traders reduce the risk of getting caught in false breakouts and keep exposure aligned with the trend.
- Check out our free forex signals
- Follow the top economic events on FX Leaders economic calendar
- Trade better, discover more Forex Trading Strategies
- Open a FREE Trading Account
- Read our latest reviews on: Avatrade, Exness, HFM and XM
Related Articles


Sidebar rates
Related Posts
