WTI Crude Oil Breaks $63.5: 3 Key Signals Traders Can’t Ignore
WTI crude oil futures are above $63.5 for the first time in three weeks. The upswing is due to stronger US demand...
Quick overview
- WTI crude oil futures have risen above $63.5 for the first time in three weeks due to stronger US demand and a significant drawdown in national inventories.
- Despite the overall upswing, Cushing inventories have increased, indicating uneven demand in the market.
- Geopolitical factors, including stalled talks in Eastern Europe and new tariffs on Indian imports, are adding complexity to investor sentiment.
- Technically, WTI crude is breaking its bearish trend, with bullish indicators suggesting potential for further upside.
WTI crude oil futures are above $63.5 for the first time in three weeks. The upswing is due to stronger US demand and changing global trade flows. A US inventory report showed the biggest national drawdown since mid-June, with refinery runs and exports driving supply tightness.
But a counterpoint comes from Cushing where inventories rose — a sign that demand is still uneven. This tug-of-war is the market’s delicate balance between demand optimism and structural weaknesses.
Meanwhile, geopolitics are influencing risk appetite. Investors are cautious as talks in Eastern Europe stall and Washington slaps a 25% tariff on Indian imports — with crude making up 35% of India’s total inflows — adds another layer of complexity.
WTI Crude Oil (USOIL) Technical Reversal in Play
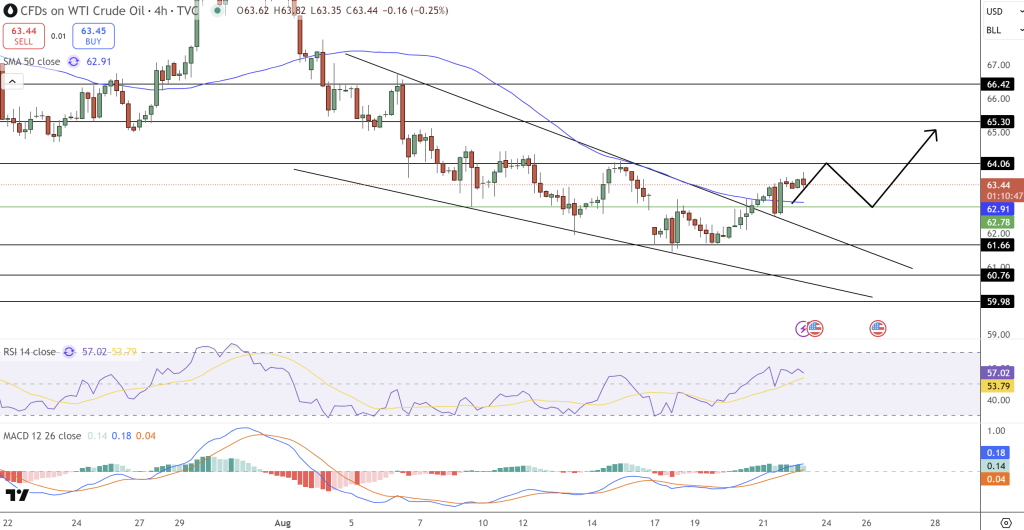
On the technicals, WTI crude is breaking its bearish streak. A descending channel breakout on the 4-hour chart is a textbook reversal pattern, selling momentum is fading. The 50-SMA at $62.91 has flipped from resistance to support, bullish conviction is growing.
Candlestick formations confirm: higher lows with bullish engulfing candles, buyer strength is growing. Momentum indicators agree. The RSI at 57 is above neutral but below overbought, room for upside. The MACD histogram is positive, a bullish crossover, momentum could sustain.
Key levels to watch:
- Resistance: $64.06 → $65.30 → $66.42
- Support: $62.80 → $61.66 → $60.76
Trade Idea for Newbies
For traders, this is an easy trade. A long trade if price closes above $64.10, target $65.30. Risk management is key — stop at $62.80.
Why this trade makes sense:
- Breakout above descending channel means trend change
- Higher lows means buyers are accumulating
- RSI and MACD both favor momentum
- Candlesticks show strong bullish sentiment
But watch for reversal signals at resistance. A shooting star or bearish engulfing candle could mean momentum is fading and the bullish view is invalid. In summary, WTI crude oil is showing its first real reversal in weeks.
- Check out our free forex signals
- Follow the top economic events on FX Leaders economic calendar
- Trade better, discover more Forex Trading Strategies
- Open a FREE Trading Account
- Read our latest reviews on: Avatrade, Exness, HFM and XM
Related Articles


Sidebar rates
Related Posts
