PayPal Stock: After 40% Drop, Is a Strong Recovery on the Horizon?

Quick overview
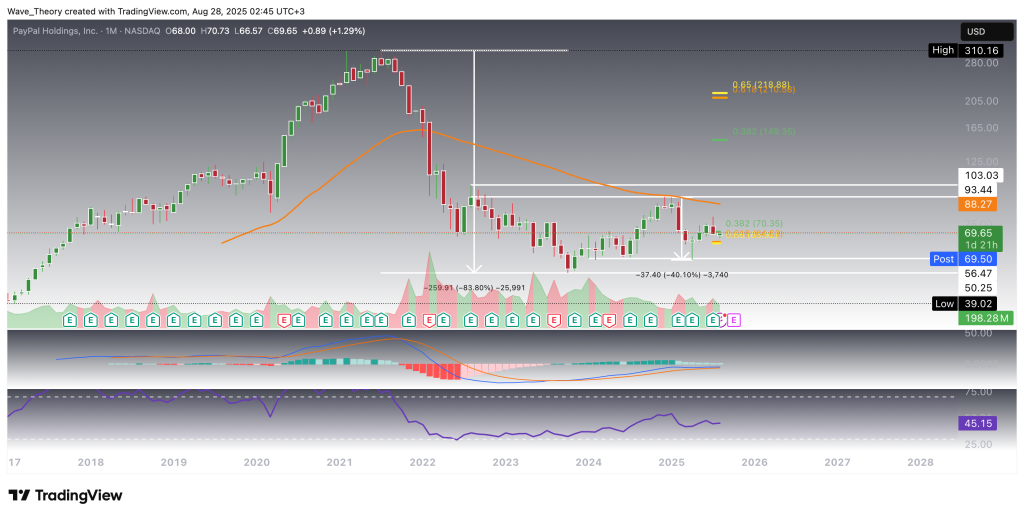
- PayPal's stock has seen an 84% decline followed by a recovery that nearly doubled its value, but it has since corrected by 40%.
- The stock faced strong resistance at the 50-month EMA around $88, leading to a bearish rejection and subsequent price correction.
- Technical indicators across multiple timeframes suggest a cautiously bearish outlook, with death crosses forming on daily and 4H charts.
- PayPal must break through the $70 resistance to regain bullish momentum, or it risks falling towards the golden ratio support at $64.
Over the past few years, PayPal’s stock has endured a staggering decline of nearly 84%. After bottoming out, the stock staged an impressive recovery, almost doubling in value during its rally. Yet, this momentum proved unsustainable, as PayPal met heavy resistance and subsequently corrected by another 40%. With such volatility in play, the pressing question remains: is PayPal poised for a meaningful recovery, or could further downside lie ahead?
PayPal Rejected at the 50-Month EMA – Bearish Signals Emerging
PayPal’s rally from $50 to $93 encountered stiff resistance at the 50-month EMA, which currently sits near $88, where the stock was decisively rejected. Since that rejection, the share price has corrected by roughly 40%, finding support at $56.4, from which it staged a bullish rebound. This bounce has carried the stock higher for the past four months, but the momentum has begun to falter.
Last month, PayPal started flashing weakening bullish momentum again. On top of that, the MACD histogram exhibits a downtrend on the monthly chart, while the MACD lines remain in a bullish crossover—a sign of weakening momentum rather than outright trend reversal. Meanwhile, the RSI remains neutral, offering no clear directional bias.
The technical setup suggests a market caught between a fading recovery and the risk of renewed downside pressure.

PayPal Faced Bearish Rejection at the Golden Ratio Resistance
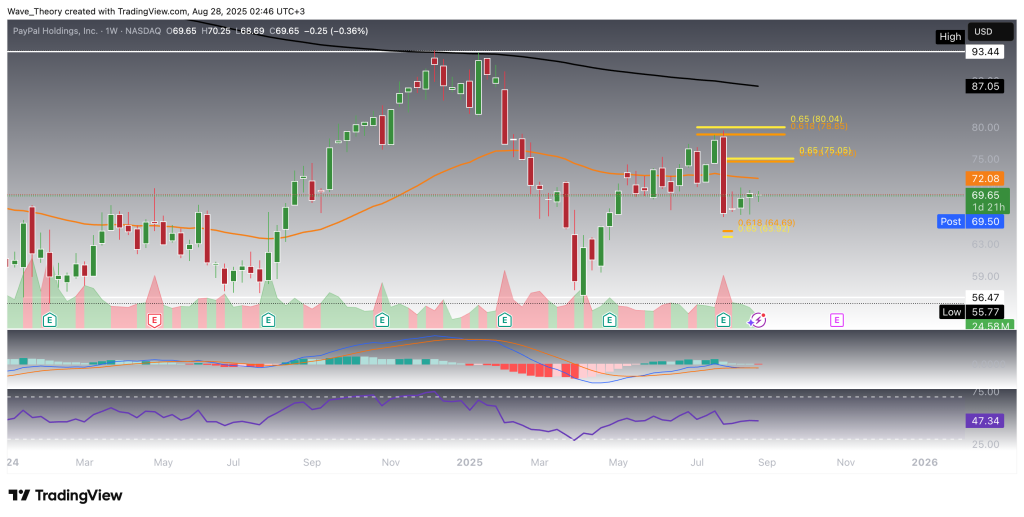
Five weeks ago, PayPal stock rallied into the golden ratio resistance at $80, where it encountered strong bearish rejection, resulting in a 16% weekly decline. Since then, the stock has managed to hold above the golden ratio support at $64, initiating a modest recovery over the past four weeks.
However, the weekly technicals remain decisively bearish. Both the MACD lines and EMAs are still bearishly crossed, underscoring a continuation of the mid-term downtrend. The MACD histogram is trending lower, further reinforcing bearish momentum. Meanwhile, the RSI remains neutral, offering no directional bias at this stage.

Death Cross on the Daily Chart
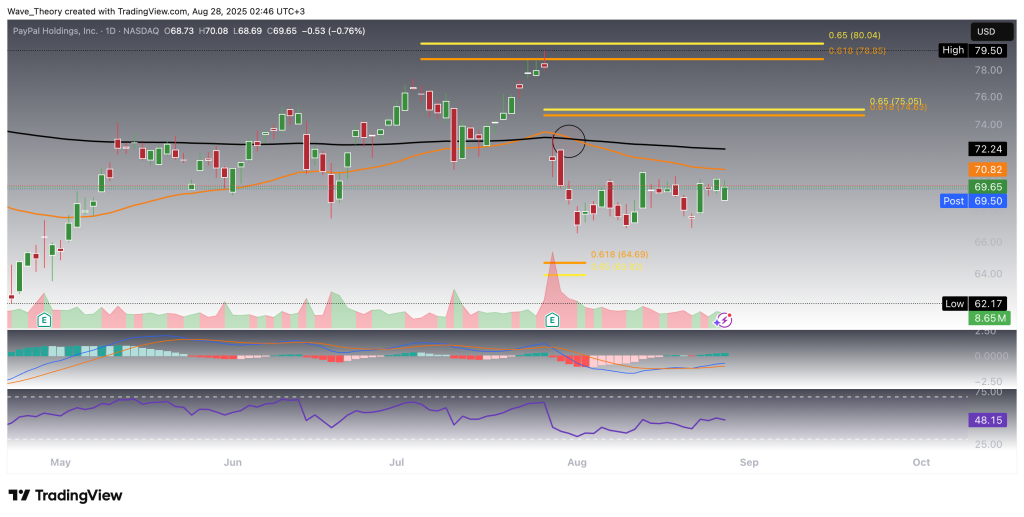
On the daily chart, PayPal’s EMAs have now formed a death cross, confirming a bearish trend in the short- to medium-term. However, there are contrasting signals from other indicators: the MACD histogram is trending higher, the MACD lines have crossed bullishly, and the RSI remains in neutral territory.
If PayPal begins a recovery to the upside, the next significant Fibonacci resistance lies at $75. A confirmed bullish break above this level could propel PayPal back to the golden ratio resistance at $80, where it previously faced strong rejection.

Similar Outlook on the 4H Chart of PayPal Stock
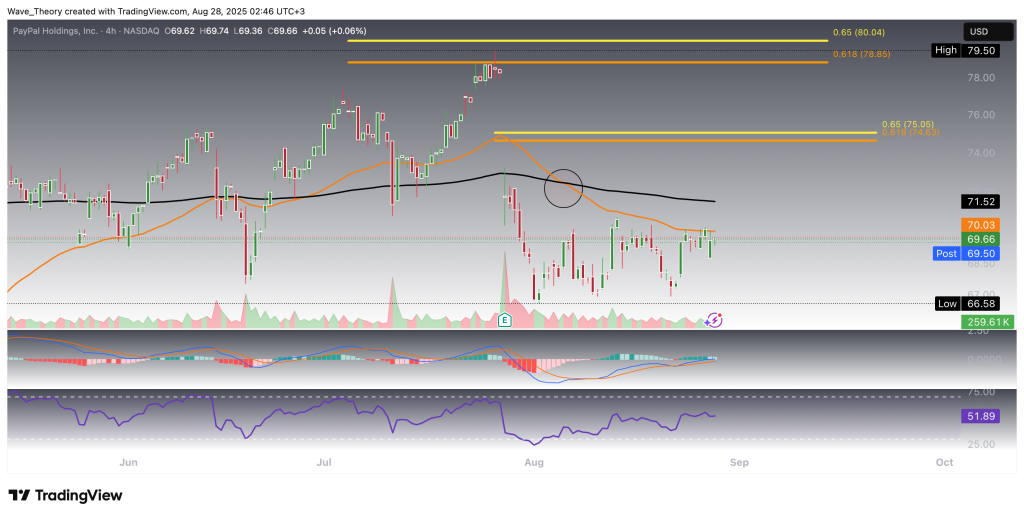
On the 4H chart, the EMAs have also formed a death cross, confirming the short-term bearish trend. In addition, the MACD histogram is currently trending lower, signaling bearish momentum, while the MACD lines remain bullishly crossed and the RSI hovers in neutral territory.
At present, PayPal is encountering resistance at the 50-4H EMA around $70. A successful bullish breakout above this level could open the path toward the next golden ratio resistances. However, if the price fails to break this resistance, it risks a decline toward the golden ratio support at $64.

PayPal’s technical outlook across the monthly, weekly, daily, and 4H charts remains cautiously bearish in the short term. On higher timeframes, the price faces heavy resistance at the 50-month EMA near $88, where multiple rejections have occurred. Both the weekly, daily and 4H charts show a death cross formation, with the MACD histogram trending lower, signaling downside pressure. While the RSI remains neutral across timeframes, PayPal must clear the $70 resistance zone to regain bullish momentum, which could pave the way toward the next golden ratio resistances around $76–78. Failure to break higher, however, leaves the stock vulnerable to a drop toward the golden ratio support at $64.
- Check out our free forex signals
- Follow the top economic events on FX Leaders economic calendar
- Trade better, discover more Forex Trading Strategies
- Open a FREE Trading Account
- Read our latest reviews on: Avatrade, Exness, HFM and XM

