Nvidia Stock Hits New All-Time High but Shows Signs of Weakening Momentum

Quick overview
- Nvidia (NVDA) reached an all-time high of $184.5 but is showing signs of entering a corrective phase.
- The stock has surged approximately 113% in recent months, yet has been trending lower for the past four weeks.
- Current momentum indicators suggest weakening bullish momentum, with the MACD histogram declining and the RSI nearing neutral territory.
- A break below the 50-day EMA at $169 could lead to further downside, with key support levels at $147 and $120.
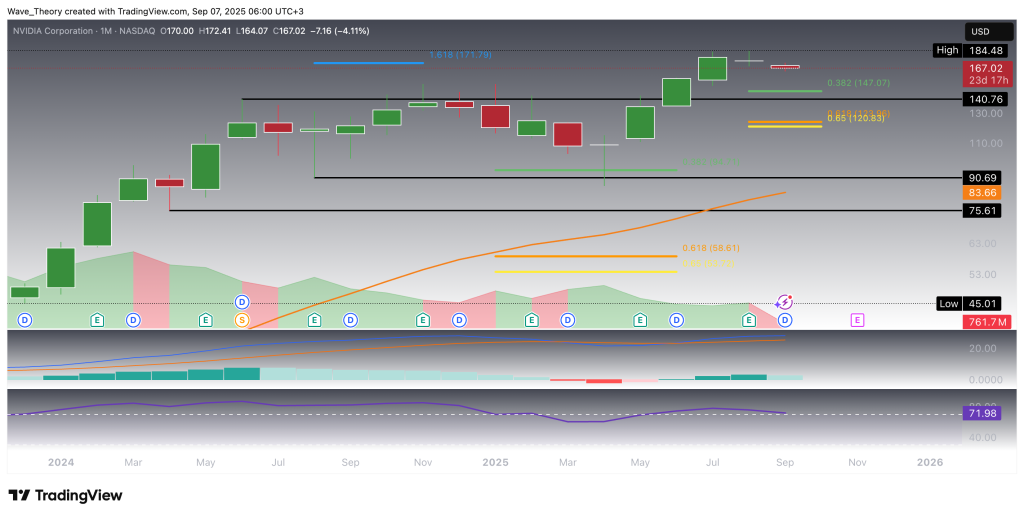
Nvidia (NVDA) reached a new all-time high near $184.5 last month, breaking above the key Fibonacci projection level at $172. While this marks a strong bullish milestone, current price action suggests the stock may now be entering the early stages of a corrective phase.
Nvidia Stock Shows Signs of Bearish Momentum
Nvidia (NVDA) has delivered a strong performance in recent months, but early signs now point toward a potential correction. After retreating from roughly $150 earlier this year, the stock found decisive support at the 0.382 Fibonacci retracement near $95, where it staged a sharp rebound. From that level, Nvidia trended higher for five consecutive months, ultimately establishing a new all-time high at $184.5.
Having reached this peak, however, the stock now appears to be entering a corrective phase. Should selling pressure intensify, key Fibonacci retracement levels present the next meaningful areas of support at $147 and $120.
Momentum indicators add weight to this view. The MACD histogram has begun to tick lower this month, reflecting weakening bullish momentum, though the MACD lines remain in a constructive bullish cross. Meanwhile, the RSI is easing back toward neutral territory, still holding slightly above overbought levels.
Taken together, Nvidia’s broader trend remains positive, but the current technical picture highlights the risk of a short-term pullback as momentum cools and price consolidates below recent highs.
 Nvidia stock
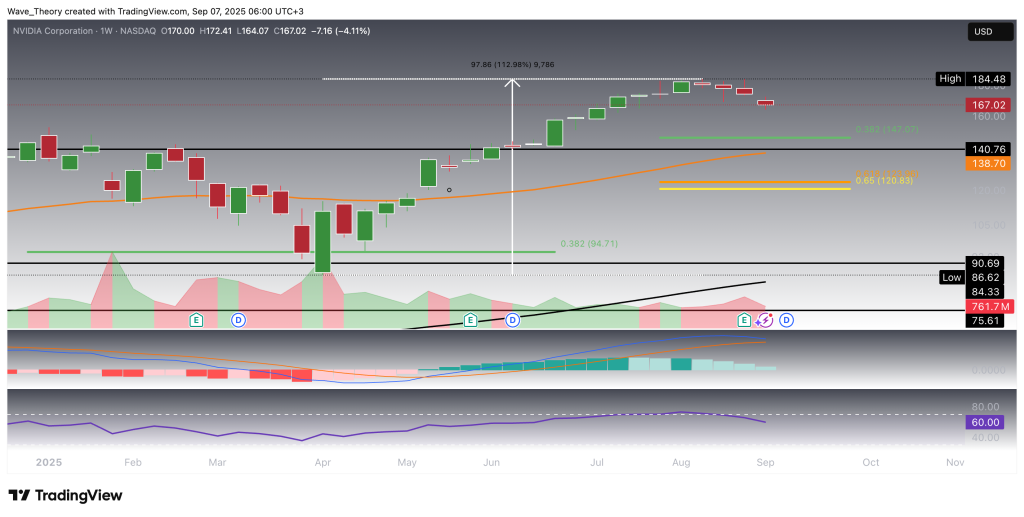
Nvidia Stock Has Surged Roughly 113% Over the Past Few Months
Nvidia (NVDA) has delivered an impressive rally of approximately 113% in recent months. However, the stock has been trending lower for the past four weeks, signaling a pause in its momentum.
From a structural perspective, both the MACD lines and EMAs remain bullishly crossed, confirming that the mid-term trend is still intact. At the same time, the MACD histogram has been declining for four consecutive weeks, suggesting that bullish momentum is gradually fading. Meanwhile, the RSI sits in neutral territory, offering neither a bullish nor bearish signal at present.
Overall, while the broader trend remains constructive, near-term price action points toward consolidation as momentum indicators cool off.
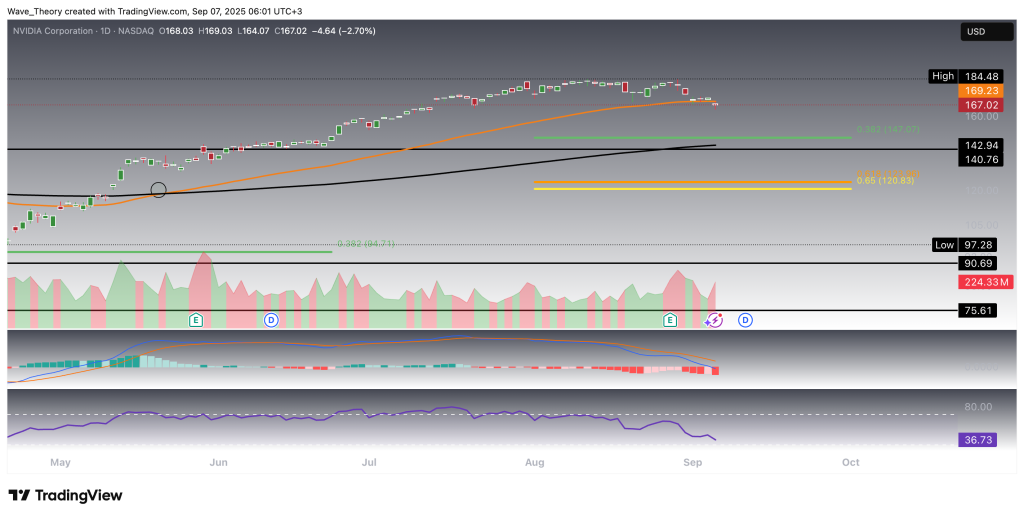
Nvidia Stock Appears to Break the 50-Day EMA at $169 Bearishly
Nvidia (NVDA) has reached the 50-day EMA at $169, which it now appears to be breaking to the downside. A confirmed break would open the door to further downside toward the next key Fibonacci retracement supports at $147 and $120.
On the daily chart, momentum indicators present a mixed picture. Structurally, the EMAs remain in a golden cross, which confirms a bullish bias in the short- to medium-term trend. However, the MACD lines have crossed bearishly, and the histogram has begun to tick lower, both pointing to weakening momentum. Meanwhile, the RSI is sliding toward oversold territory, which could soon provide relief if selling pressure exhausts.
In sum, Nvidia is testing a critical technical level. A sustained break below the 50-day EMA would expose deeper retracements, but oversold conditions may also trigger a near-term bounce.
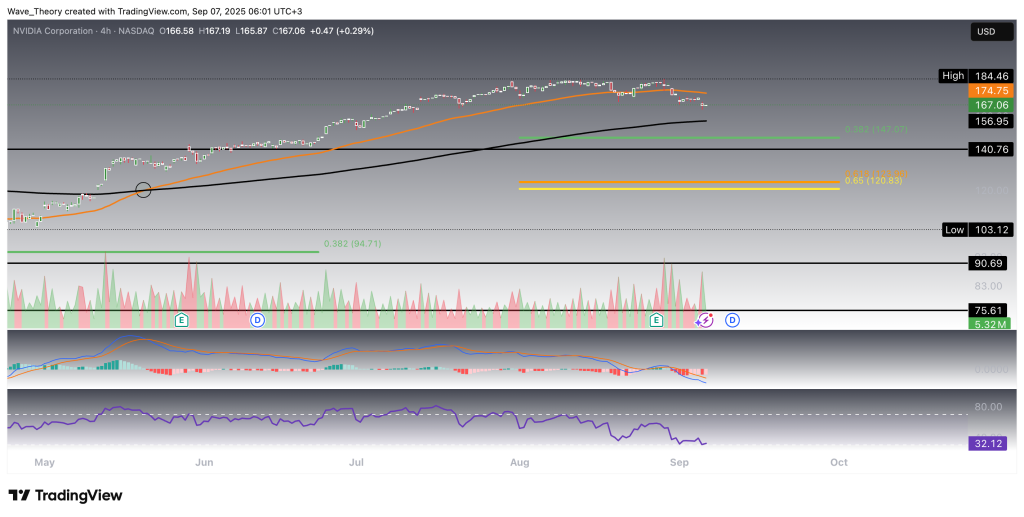
The 4H Chart Paints a Similar Picture
On the 4H chart, Nvidia shows a comparable structure to the daily timeframe. The EMAs have formed a golden cross, confirming the short-term trend as bullish. In addition, the MACD histogram is currently ticking higher, suggesting a potential momentum recovery.
That said, the MACD lines remain bearishly crossed, reflecting underlying caution, while the RSI hovers near oversold territory. This indicates that NVDA remains in a corrective phase, but the setup leaves room for a bullish rebound off key support levels if buying interest re-emerges.
- Check out our free forex signals
- Follow the top economic events on FX Leaders economic calendar
- Trade better, discover more Forex Trading Strategies
- Open a FREE Trading Account
- Read our latest reviews on: Avatrade, Exness, HFM and XM
Related Articles

Sidebar rates
Related Posts
