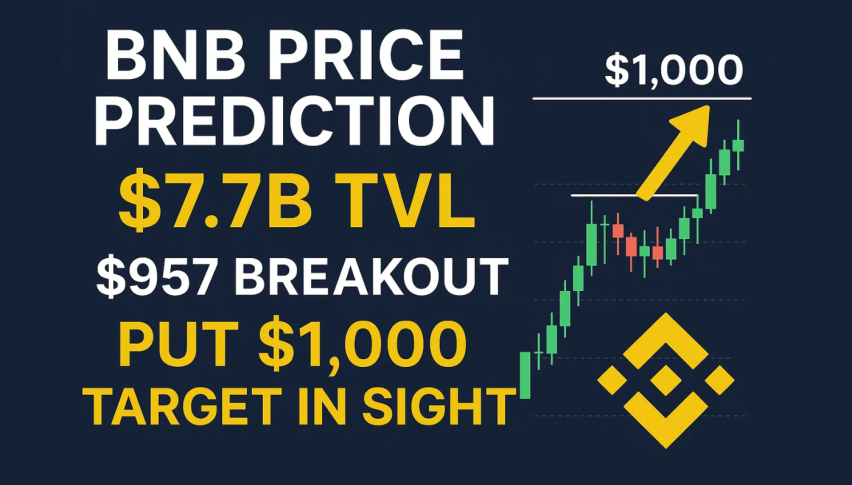
BNB Price Prediction: $7.7B TVL and $957 Breakout Put $1,000 Target in Sight
BNB is trading at $957.4, up 4% in 24 hours, with a market cap of $133.3 billion. On-chain activity is steady.
Quick overview
- BNB is currently trading at $957.4, up 4% in the last 24 hours, with a market cap of $133.3 billion.
- Total Value Locked (TVL) across BNB protocols is at $7.74 billion, nearing its all-time high.
- Stablecoin circulation on the BNB chain has reached $11.2 billion, indicating increased liquidity and user confidence.
- Technical indicators suggest a potential breakout for BNB if it surpasses the $965.1 resistance level.
BNB is trading at $957.4, up 4% in 24 hours, with a market cap of $133.3 billion. On-chain activity is steady. Total Value Locked (TVL) across BNB protocols is at $7.74 billion, just below the all-time high of $7.8 billion.
Stablecoin circulation on the BNB chain has also reached $11.2 billion, showing increasing liquidity and user confidence. Analysts note that stablecoin accumulation often precedes higher trading activity, so this is good for BNB-based apps.
Other metrics include $1.66 billion in futures open interest, indicating speculative inflows and demand. All of this points to an ecosystem that’s getting more engaged.
- TVL: $7.74B (near record highs)
- Stablecoin supply: $11.2B
- Open Interest: $1.66B
BNB Technicals Point to Breakout Setup
From a chart perspective, BNB has been in an ascending channel since early September, with higher lows and higher highs. The 50-SMA at $914.2 and the 200-SMA at $824.4 are both sloping up, so bullish.
Candlestick patterns are consolidating at $965.1 resistance, with smaller candles showing traders are taking a breather after big gains. The RSI at 72 is overbought, so short-term pullbacks are possible before continuation.
If buyers can clear $965.1, price targets open at $986.7 and the psychological $1,001.7 mark. If not, it’s back to $944.7 support where demand and the channel midline meet.

BNB Trade Setup and Forecast
Think of BNB as climbing a staircase. Above $965 and it’s sprinting to $986 and $1,001. But if momentum stalls, $944 is the next landing point.
For traders:
- Aggressive entry: Long above $965, with stops under $944, targeting $986 and $1,001.
- Conservative entry: Buy dips at $944, with stops at $912, and ride the channel higher. Fundamentals and technicals are set. BNB is ready to go.
- Check out our free forex signals
- Follow the top economic events on FX Leaders economic calendar
- Trade better, discover more Forex Trading Strategies
- Open a FREE Trading Account
- Read our latest reviews on: Avatrade, Exness, HFM and XM
Related Articles


Sidebar rates
Related Posts
