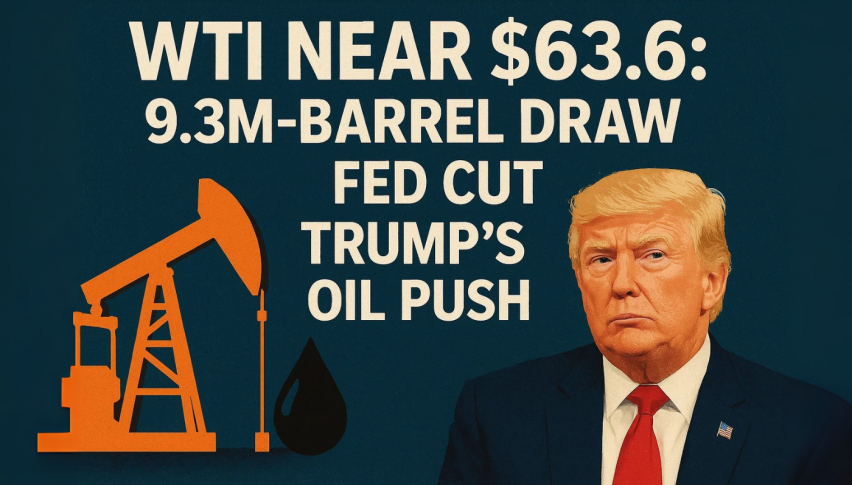
WTI Near $63.6: 9.3M-Barrel Draw, Fed Cut, and Trump’s Oil Push
WTI crude trades around $63.6 after two consecutive weeks of gains, cooling as traders weighed policy signals and supply headlines.
Quick overview
- WTI crude is trading around $63.6 after two weeks of gains, influenced by Federal Reserve rate cuts and supply concerns.
- President Trump expressed a preference for lowering oil prices rather than imposing more sanctions on Russia, easing supply disruption fears.
- U.S. crude inventories saw a significant draw of 9.3 million barrels, while distillate stocks rose, raising demand concerns.
- The near-term outlook is bearish, with key support at $62.43 and resistance levels between $63.40 and $64.74.
WTI crude trades around $63.6 after two consecutive weeks of gains, cooling as traders weighed policy signals and supply headlines. The Federal Reserve cut rates by 25 basis points for the first time since December and signaled more easing ahead to support a weakening labor market. While looser policy can boost fuel demand, investors also see it as a warning of softer growth in the world’s largest oil consumer.
Politics added another layer. In a joint press conference with UK Prime Minister Keir Starmer, President Donald Trump said he preferred bringing oil prices lower over adding more sanctions to pressure Russia. His comments tempered concerns about supply disruptions from recent Ukrainian strikes on Russian energy infrastructure.
On the fundamentals side, government data showed a 9.3 million-barrel draw in U.S. crude inventories last week, led by stronger exports. At the same time, distillate stocks rose by nearly 4 million barrels, reaching their highest level since January, raising new demand concerns.
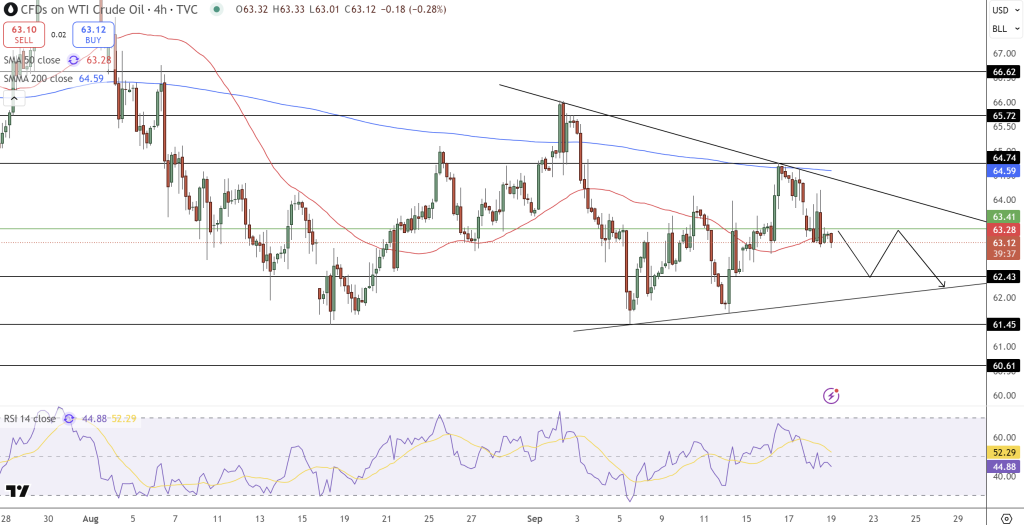
USOIL 4H chart: trend and levels
On the 4-hour chart, crude trades below the 200-day SMA near $64.59 and is hovering just above the 50-day SMA at $63.28. Price action has formed a descending triangle, reflecting lower highs against flat support.
Momentum is soft, with the RSI near 45, showing limited buying strength. Key resistance levels stand at $63.40–$63.60, followed by $64.59–$64.74. On the downside, immediate support is $62.43, with deeper levels at $61.45 and $60.61.
WTI Crude Oil (USOIL): Trade plan and risks
The near-term bias is modestly bearish as long as prices remain below the descending resistance line and the 200-SMA. A break under $62.43 could accelerate selling pressure toward $61.45 and $60.61. On the flip side, a daily close above $64.74 would challenge the bearish setup and open the way toward $65.72–$66.62.
Key takeaways for traders:
- Short-term bias favors sellers below $64.70.
- A breakdown under $62.43 points to $61.45 and $60.61.
- Bulls need a decisive close above $64.74 to flip momentum.
- Check out our free forex signals
- Follow the top economic events on FX Leaders economic calendar
- Trade better, discover more Forex Trading Strategies
- Open a FREE Trading Account
- Read our latest reviews on: Avatrade, Exness, HFM and XM
Related Articles


Sidebar rates
Related Posts
