XRP Price Forecast: $3.50 Breakout in Sight as Bulls Guard $2.97
XRP traded around $3.01 into the weekend after a choppy week that still preserved the broader uptrend. Daily turnover topped $4.16B...
Quick overview
- XRP traded around $3.01 after a volatile week, maintaining a broader uptrend with a daily turnover exceeding $4.16B.
- Institutional interest remains strong as the SEC approved new listing standards for spot crypto ETFs, benefiting XRP-linked products.
- XRP's price chart shows a potential bullish pattern with key support at $2.97 and resistance at $3.19, indicating possible trading strategies.
- Market dynamics suggest that new ETF offerings could reduce sell pressure and enhance liquidity for XRP in the coming weeks.
XRP traded around $3.01 into the weekend after a choppy week that still preserved the broader uptrend. Daily turnover topped $4.16B, market cap hovered near $179.8B, and the coin held #3 by ranking with 59.78B tokens in circulation (max 100B). Institutional chatter stayed loud: the SEC cleared new generic listing standards that fast-track spot crypto ETFs, while Grayscale’s Digital Large Cap fund—holding BTC, ETH, XRP, SOL, and ADA—won approval under the framework. Together, these moves lower the friction for XRP-linked products and keep fresh capital in play.
Drivers: ETFs, policy, liquidity
ETF plumbing matters because it broadens access and standardizes custody, pricing, and market-making—key for sustained inflows. Reports also flagged new spot XRP and DOGE ETFs debuting with solid early volumes, a signal that demand extends beyond Bitcoin and Ether. If that momentum holds, secondary effects include tighter available float and reduced sell pressure on rallies, especially if issuers warehouse inventory to meet creations. Macro remains a swing factor, but with clearer rules and a growing product shelf, XRP’s institutional story keeps improving.
XRP price prediction: key levels
On the 4-hour chart, XRP has carved a textbook inverse head-and-shoulders. Price reclaimed the neckline and is coiling between the 50-EMA (≈$3.03) and 200-EMA (≈$2.98), creating a tight battleground. Candles show long lower wicks on dips—evidence of bid support—while RSI ~50 leaves room for either side to take control. The playbook:
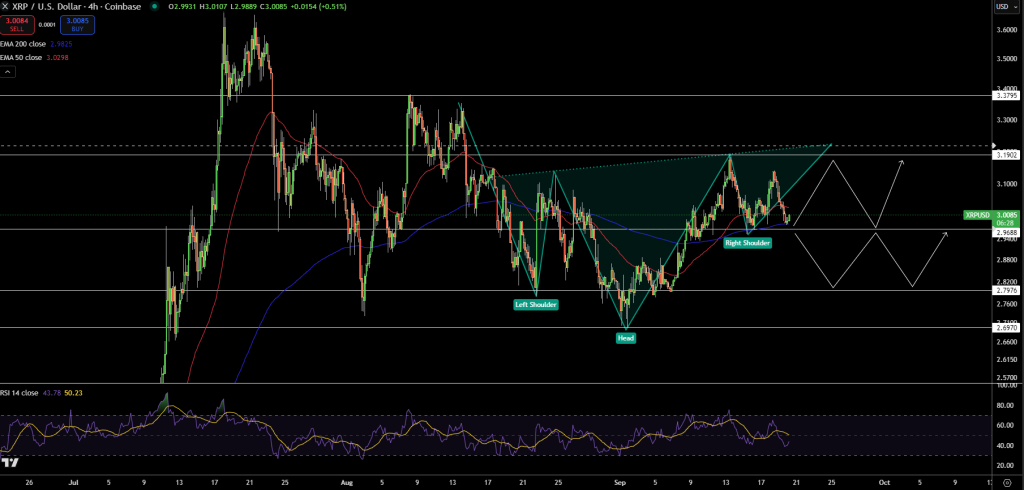
- Support: $2.97–$2.98 (200-EMA/neckline retest)
- Resistance: $3.19; breakout exposes $3.37 then $3.50
- Failure zone: Below $2.97 risks a slide toward $2.80
How to trade it:
Consider a trend-continuation long on a 4H close above $3.19 with rising volume or a bullish engulfing/hammer. Place a stop below $2.97 to cap risk.
Targets: scale at $3.37, leave a runner for $3.50 if momentum prints three white soldiers or if EMA alignment turns decisively bullish. If price instead prints a shooting star or three black crows near $3.19, stand down and wait for a cleaner retest of $2.97–$2.98. This keeps you trading with the structure—higher lows inside a rising channel—rather than guessing tops.
- Check out our free forex signals
- Follow the top economic events on FX Leaders economic calendar
- Trade better, discover more Forex Trading Strategies
- Open a FREE Trading Account
- Read our latest reviews on: Avatrade, Exness, HFM and XM
Related Articles


Sidebar rates
Related Posts
