Disney (DIS) Stock Tests Decade-Long Support Level Amid Market Pressure

Quick overview
- The Walt Disney Company (DIS) has experienced a remarkable long-term appreciation of 93,154%, but has faced a significant 60.5% correction since 2021.
- Currently, DIS is testing critical support at the golden ratio level of $77, with resistance at $126 and $159.
- The technical indicators present a mixed outlook, with bullish signals from the EMAs but bearish trends in the MACD on the weekly chart.
- A bullish break above the 0.382 Fibonacci resistance at $126 could signal a potential shift in the current corrective phase.
The Walt Disney Company (DIS) has delivered an extraordinary long-term performance, appreciating by an impressive 93,154% over the past decades. However, since 2021, the stock has undergone a sharp decline, extending its corrective move all the way down to the most critical Fibonacci support level. The key question now is whether DIS will find the strength for a rebound at this pivotal juncture.
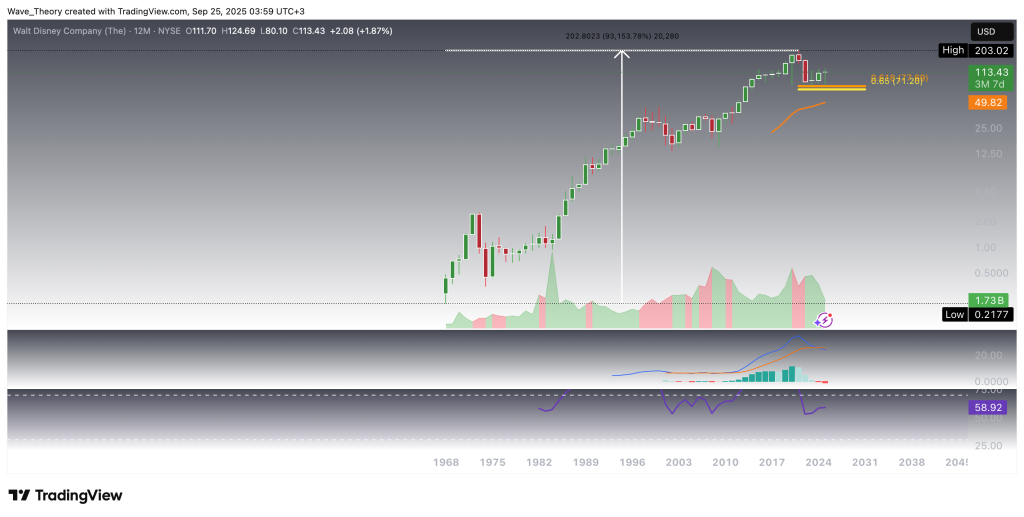
After 93,154% Surge, Disney Faces a 60.5% Correction
Since 1968, The Walt Disney Company (DIS) has delivered an extraordinary rally of over 93,154%, cementing its place as one of the most successful long-term performers in the market. However, in 2021 the stock entered a significant corrective phase, retracing 60.5% from its all-time high of $203. On the yearly chart, the MACD lines have crossed bearishly, with the MACD histogram trending lower, reinforcing the corrective outlook. Meanwhile, the RSI remains neutral, providing neither bullish nor bearish confirmation at this stage.
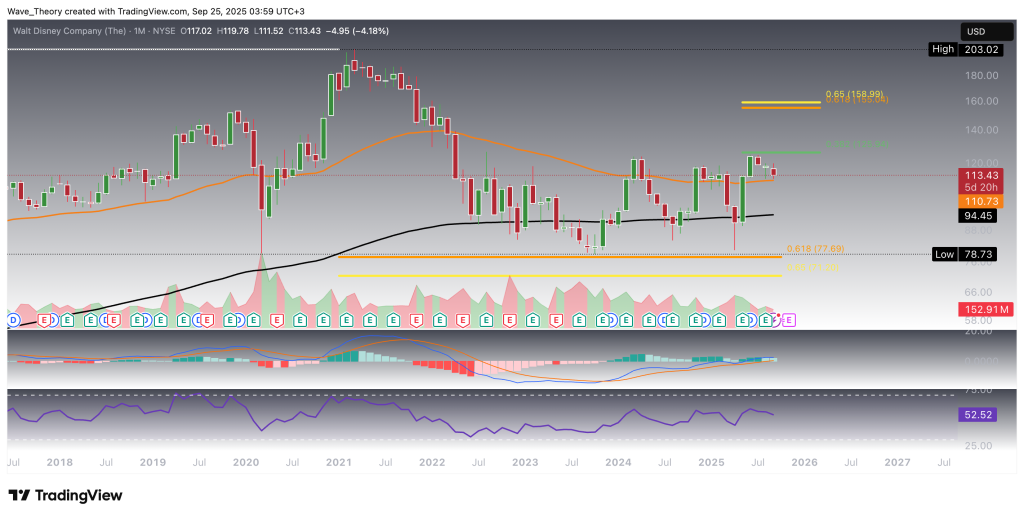
Disney Stock Faces Major Resistance
Disney (DIS) has retraced all the way down to the golden ratio support at $77—a historically critical level that spans from the all-time low to the all-time high. This is arguably the most important long-term support for the stock, where it managed to bounce bullishly, surging to the 0.382 Fibonacci resistance at $126 while also breaking above the 50-month EMA resistance at $111.
However, at the 0.382 Fib resistance ($126), the stock appears to have met bearish rejection, pulling it back toward the 50-month EMA at roughly $111, which now acts as immediate support.
On the monthly chart, the indicators present mixed signals. The EMAs remain bullishly crossed, forming a golden crossover that confirms the long-term trend bullishly. On topf that, the MACD lines are bullishly crossed. In contrast, the MACD histogram has been ticking lower since last month, while the RSI remains neutral, offering neither bullish nor bearish confirmation.
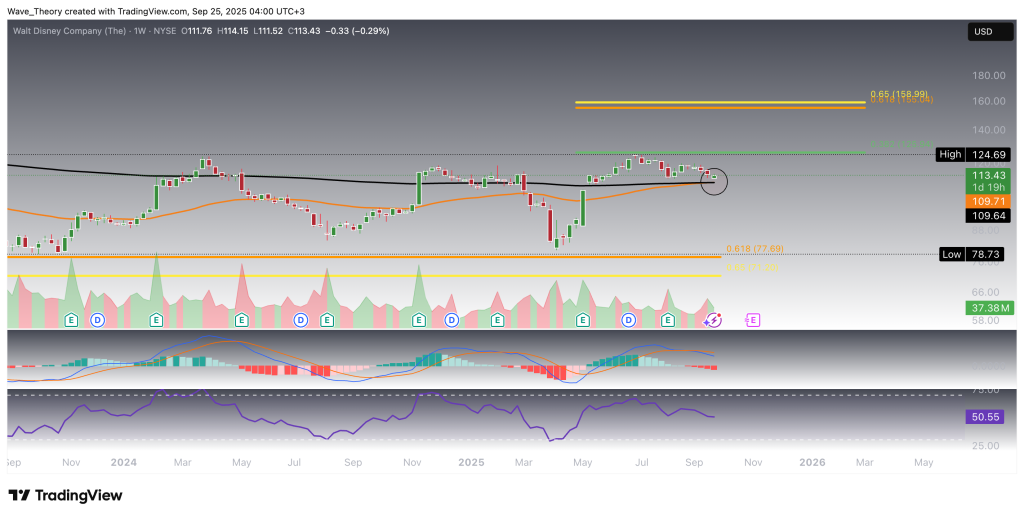
Golden Crossover Emerges on the Weekly Chart
On the weekly chart, Disney (DIS) presents a mixed technical picture. The MACD lines remain bearishly crossed, with the MACD histogram confirming a clear bearish trend. Meanwhile, the RSI hovers in neutral territory, offering no clear directional bias.
However, the EMAs are on the verge of forming a golden crossover, which would confirm the trend bullishly in the mid-term. At present, Disney faces major resistance at roughly $126 and strong support at $77. A bullish break above the 0.382 Fibonacci resistance at $126 could open the door for a test of the critical golden ratio resistance at $159. Until that level is broken, however, the broader correction phase that began in 2021 remains intact.
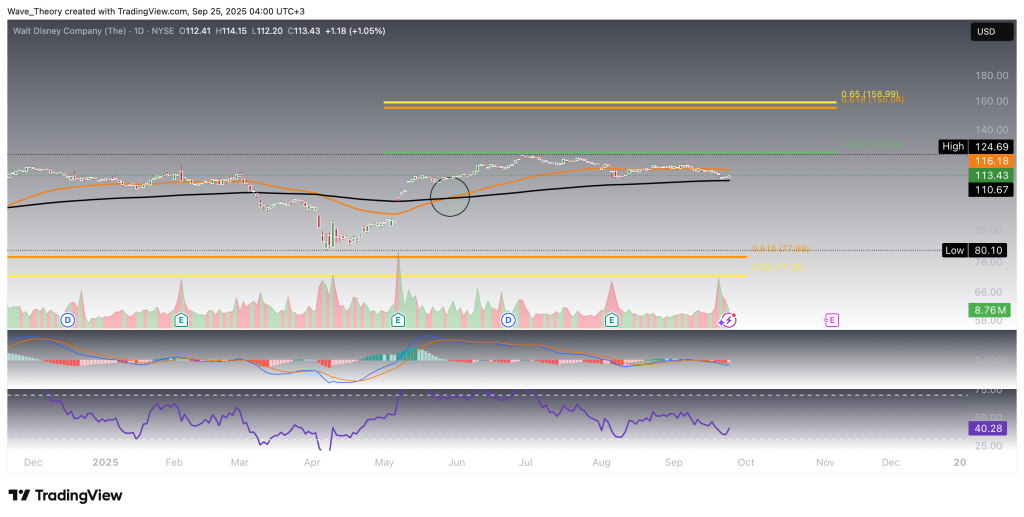
Golden Crossover on the Daily Chart
On the daily chart, the EMAs have already established a golden crossover, confirming the trend bullishly in the short- to medium term. However, the MACD lines remain bearishly crossed, even as the MACD histogram has started to tick bullishly higher today, hinting at potential momentum shift. The RSI stays neutral, providing no additional confirmation.
At present, Disney (DIS) finds support around $111, aligned with both the 200-day EMA and the 50-month EMA.
Summary
Disney (DIS) has corrected 60.5% from its all-time high at $203, finding major long-term support at the golden ratio level of $77. From there, it rebounded strongly to the 0.382 Fib resistance at $126, also breaking the 50-month EMA at $111, which now acts as key support.
On the weekly chart, EMAs are close to forming a golden crossover, but until the golden ratio resistance at $159 is broken, the broader correction phase since 2021 remains intact. On the daily chart, the EMAs have already established a golden crossover, with support confirmed at $111.
Key Levels: Support at $77 and $111; resistance at $126 and $159.
- Check out our free forex signals
- Follow the top economic events on FX Leaders economic calendar
- Trade better, discover more Forex Trading Strategies
- Open a FREE Trading Account
- Read our latest reviews on: Avatrade, Exness, HFM and XM
Related Articles

Sidebar rates
Related Posts
