Solana Faces Critical Test Under $200 as Bears Dominate Despite Looming SOL ETF Catalyst
SOL drops 7.5% in 24 hours as technical indicators flash warning signals, but institutional demand and regulatory developments could reshape
Quick overview
- Solana (SOL) is currently facing significant selling pressure, trading at approximately $194 after a 7.5% drop in the last 24 hours.
- The altcoin has lost about 19% of its value in a week, raising concerns about its short-term momentum and testing critical support levels.
- Despite recent declines, technical indicators suggest potential seller exhaustion, with a historical 80% success rate for recoveries after similar oversold conditions.
- Institutional interest in Solana could increase with the potential approval of Grayscale's spot SOL ETF, which may attract significant capital inflows.
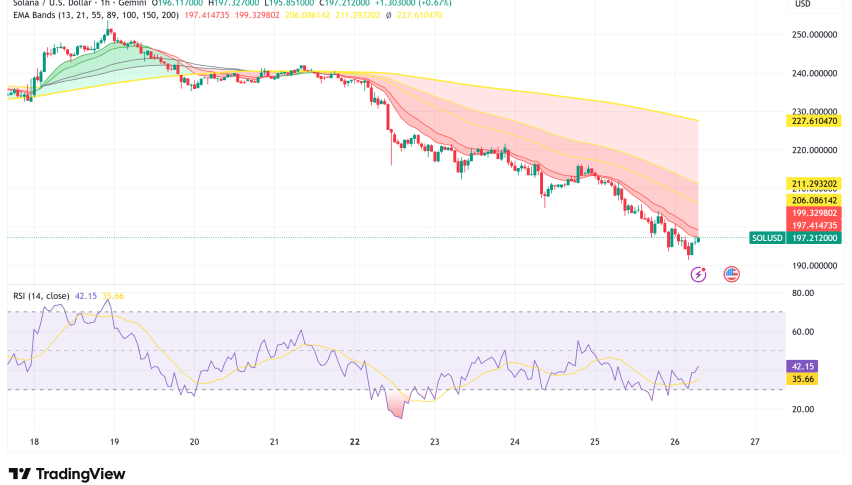
Solana SOL/USD is experiencing severe selling pressure; it is trading at about $194 after down more than 7.5% in the last 24 hours. The most recent drop is the latest in a series of significant changes after the altcoin reached an eight-month high of $253. It has lost about 19% of its value in just one week, which raises worries about its short-term momentum.
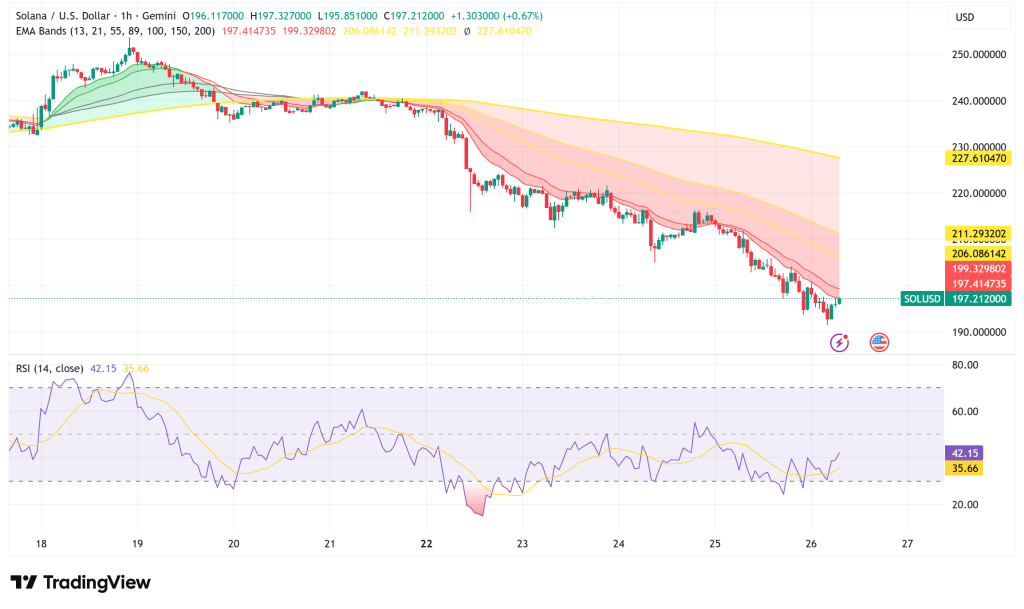
SOL/USD Technical Analysis: Seller Exhaustion Despite Bearish Momentum
From a technological point of view, SOL is at a very important point in time. The coin has fallen below the $200 mark, which is critical for the mind, and is now testing the 50-day Exponential Moving Average (EMA) at about $209.58. If the price breaks below this level, it might cause more selling pressure toward the next key support zone at $184.13.
But technical indicators are starting to reveal hints that sellers may be getting tired. The Relative Strength Index (RSI) on the four-hour chart has dropped below 30, which has been a key threshold for SOL in the past when it has hit bottom or bounced back. This oversold scenario has happened five times since April 2025. Four of those occasions, the market quickly bounced back, which means that this technical indicator has an 80% success rate.
Even if there was a drop recently, the daily chart structure is still good, and SOL is still making higher highs and higher lows. The latest drop is happening in a critical demand zone between $200 and $185, which is also where the 0.50-0.618 Fibonacci retracement levels are. This is a place where traders usually look for possible technical rallies.
Solana’s On-Chain Metrics Paint Concerning Picture
On-chain data shows that there are problems with the network’s fundamentals that go beyond price action. Since mid-June, the number of Daily Active Addresses has been steadily going down. As of this week, there are 2.43 million. This measure, which shows how much the blockchain is being used over time, reveals that less people want Solana’s network services.
Data on derivatives backs up the pessimistic mood even further. The long-to-short ratio for SOL is at 0.80, which means that more traders are betting on prices going down. Also, the Futures Taker CVD (Cumulative Volume Delta) became negative on September 13 and has been going down continuously since then, showing that there is still a lot of selling pressure in the futures market.
Solana ETFs and Institutional Adoption Could Provide Long-Term Support
Even though there are several technical and fundamental problems in the short term, a number of things could change Solana’s path. Grayscale’s spot SOL exchange-traded fund has its first regulatory deadline on October 10. If it gets approved, it might open the door to a lot of institutional money, just like Bitcoin and Ethereum did last year.
The possible effects of ETF approval can’t be overstated. Pantera Capital’s asset managers recently said that SOL is “next in line for its institutional moment.” They pointed out that institutions own about 16% of Bitcoin and 7% of Ethereum, yet less than 1% of SOL’s supply is owned by institutions. If the regulators give their approval, this might be a big chance for capital to flood in.
Recent additions to corporate treasuries back this idea. Helius Medical Technologies said it bought more than 760,190 SOL tokens for an average price of $231. This brings its overall holding to almost $167 million. Galaxy Digital’s earlier purchase of 1.2 million SOL tokens for $306 million shows that institutional interest is rising even more.
Regulatory Developments Add Complexity
The rules are always changing, and the EU’s Markets in Crypto-Assets (MiCA) law will go into effect in December 2024. These frameworks might make things more complicated and expensive for businesses, but they also promise clearer legal rules that could help institutions adopt them.
Kazakhstan’s central bank just started a pilot experiment with a new stablecoin called Evo. Solana and Mastercard worked together to make it. These kinds of cooperation show how Solana is becoming more integrated into traditional banking processes and how useful it is in the real world.
Solana Price Prediction and Market Outlook
SOL is about to face a big test at these levels. The $185–$200 zone is a big area of demand. If prices stay above this range, the overall uptrend structure is likely to stay intact. But if the price falls below $185, it might lead to more selling down to the $170-$156 region, which would make the trend much weaker.
If the historical RSI pattern holds true, there is a chance of a short-term recovery, which might lead to a bounce back to the $230 resistance level. But for upward momentum to last, there will likely need to be either an ETF approval catalyst or an improvement in the underlying network metrics.
Prediction markets say there is only a 41% chance that SOL will hit new all-time highs in 2025. This shows that the market is still skeptical, even when there is speculation about ETFs. This conservative view says that investors should be careful about the token’s capacity to keep going up without any major changes.
- Check out our free forex signals
- Follow the top economic events on FX Leaders economic calendar
- Trade better, discover more Forex Trading Strategies
- Open a FREE Trading Account
- Read our latest reviews on: Avatrade, Exness, HFM and XM
Related Articles


Sidebar rates
Related Posts
