Ethereum Surges Past $4,200: Technical Signals and Exchange Data Point to Potential October Rally
Cryptocurrency traders are positioning for continued gains as Ethereum ETH reclaims key psychological level amid bullish onchain indicators
Quick overview
- Ethereum has rebounded above $4,000, currently trading around $4,200, marking a 2% increase in the last 24 hours.
- ETH exchange reserves have hit an eight-year low, indicating increased institutional accumulation and a shift in investor behavior towards self-custody and staking.
- Weekly DEX volumes on Ethereum surged by 47%, suggesting renewed interest in the platform and a potential correlation with price growth.
- Historical data shows October typically brings an average gain of 4.77% for Ethereum, with analysts predicting a bullish trend for the month.
Ethereum ETH/USD has made a remarkable comeback, rising back above $4,000 to trade around $4,200, which is about a 2% increase in the last 24 hours. This rise has given traders and analysts new hope, and they are now looking at a possibly bullish October based on strong technical, historical, and on-chain evidence.
ETH Exchange Reserves Hit Eight-Year Low as Institutional Accumulation Accelerates
The steep drop in ETH supply on centralized exchanges, which has hit its lowest level since 2016, is one of the most important positive signs that Ethereum’s price will go up again. This trend shows that institutions are buying more Ethereum and that investors are changing the way they keep their Ethereum holdings.
CryptoQuant researcher CryptoMe says that the falling exchange reserves are mostly due to three things: investors putting ETH into self-custody wallets, moving it to staking sites, and moving it to new wallet addresses. Total exchange outflows have reached levels not seen since the depths of the 2022 bear market, when quantitative tightening was at its worst and immediately before the FTX crisis caused huge withdrawals from centralized platforms.
“When demand hits, the rally begins.” CryptoMe said, “Falling reserves prepare the ground for that rally,” meaning that the way the supply is changing right now is making it easier for prices to go up a lot when purchasing pressure rises.
Ethereum DEX Activity Surges 47% Week-Over-Week
Ethereum’s decentralized exchange (DEX) ecosystem is making a big comeback, in addition to the exchange reserve data. Weekly DEX volumes on the Ethereum network rose 47% from $22.9 billion to $33.9 billion, showing that people are once again interested in and using the platform.
Ethereum’s competitors didn’t see nearly as much growth in volume. For example, Solana only grew by 6% and BNB Chain only grew by 8.3% within the same time period. The rise was fueled by strong showings from prominent protocols, such as Uniswap’s 26% increase and Maverick Protocol’s 30% volume gain.
Based on past patterns, this jump in DEX volume might be very good for the price of ETH. Between June 30 and August 14, when weekly DEX volume rose 276% to record highs of $40 billion, Ethereum’s price nearly doubled. This showed a significant link between on-chain demand and price growth.
October’s Historical Performance Suggests 4.77% Average Gains
September was hard for Ethereum, with ETH dropping 6% like it usually does. But October has always been a much better month for the second-largest cryptocurrency. CoinGlass’s historical data shows that October had an average increase of 4.77%, which would bring ETH closer to $4,300 from where it is now.
“Ethereum monthly returns history shows a clear pattern that October and beyond is a bullish season,” said crypto expert Marzell. “October is often the ignition…” Get ready for the $ETH pump in Q4! Another expert, Midas, agreed with this and said that ETH looks like it’s following the same trend as it did in Q3 2020, which led to gains of more than 100% in Q4 of that year.
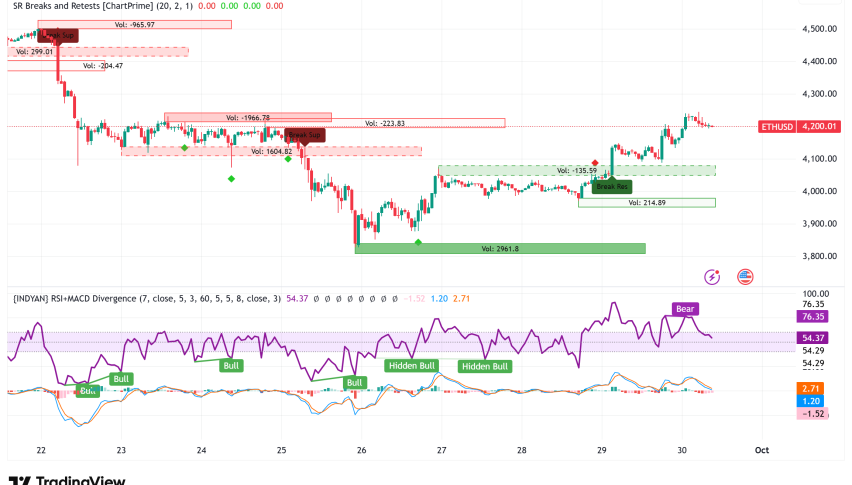
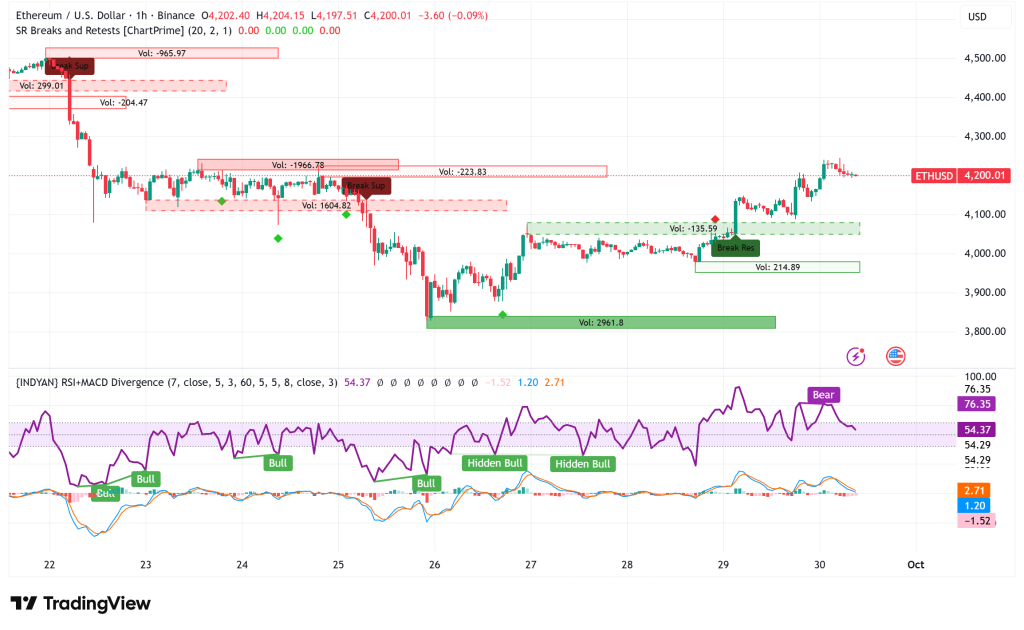
ETH/USD Technical Analysis: Key Resistance at $4,250 Could Unlock Rally to $4,957
From a technical point of view, Ethereum is now holding above important support levels. The cryptocurrency is trading above the 100-hourly Simple Moving Average and has set up a bullish trend line with support at $4,100. ETH has also gotten back to the 76.4% Fibonacci retracement level of its recent falling wave, which went from $4,275 to $3,826.
The 20-day exponential moving average at about $4,262 and the $4,250 resistance zone are the next problems to deal with. Analysts think that if buyers can get past this level, there will be a rally into the resistance line. If buyers can break and close above this level, it might lead to $4,957. If the $4,275 level is broken, it might lead to more movement toward $4,320, with longer-term goals of $4,450 to $4,500.
If the price doesn’t break through the $4,250 resistance, it could pull back. The first support level is at $4,150, and the main support level is at the $4,100 trend line. If the price drops below $4,100, the focus would shift to the $4,050 and possibly $4,000 support levels. If the price drops still further, it may go as low as $3,880.
- Check out our free forex signals
- Follow the top economic events on FX Leaders economic calendar
- Trade better, discover more Forex Trading Strategies
- Open a FREE Trading Account
- Read our latest reviews on: Avatrade, Exness, HFM and XM
Related Articles


Sidebar rates
Related Posts
