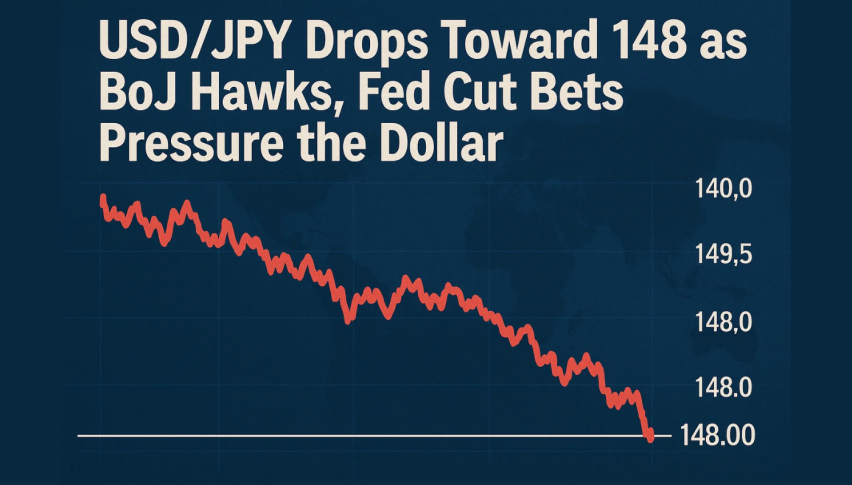
USD/JPY Drops Toward 148 as BoJ Hawks, Fed Cut Bets Pressure the Dollar
USD/JPY dipped to 147.98 in Tuesday’s European session, extending losses after peaking at 149.93. Selling the US Dollar (USD)...
Quick overview
- USD/JPY fell to 147.98, influenced by a hawkish Bank of Japan and selling pressure on the US Dollar.
- Despite weak domestic data in Japan, the Yen remains strong due to the BoJ's potential for faster normalization.
- Technical analysis shows USD/JPY testing key levels, with bearish momentum indicated by recent price action.
- Traders should wait for candle confirmation before making any moves, as the trendline's stability will dictate the next direction.
USD/JPY dipped to 147.98 in Tuesday’s European session, extending losses after peaking at 149.93. Selling the US Dollar (USD) and hawkish BoJ has boosted the Yen.
The BoJ’s September Summary of Opinions showed growing support among policymakers for faster normalization, with markets now pricing in a 25-basis-point hike as early as October.
While dovish members are concerned about inflation risks and global headwinds, investors are focusing on the hawkish bias. The policy gap with the US Federal Reserve (where markets expect at least two rate cuts before year-end) is adding to the Yen’s strength.
Weak Data Doesn’t Stop Yen
Japan’s domestic data is weak. Retail Sales fell 1.1% year-on-year in August, the biggest decline since 2021, while Industrial Production dropped 1.2% vs forecasts of -0.7%. Although these numbers show economic strain, the BoJ’s hawkish stance has overshadowed the weakness, so the Yen is supported.
At the same time, political uncertainty in Washington (government shutdown threat) is weighing on the Greenback, so demand for safe-haven currencies like the Yen is increasing.
Technical Setup and Trade Ideas
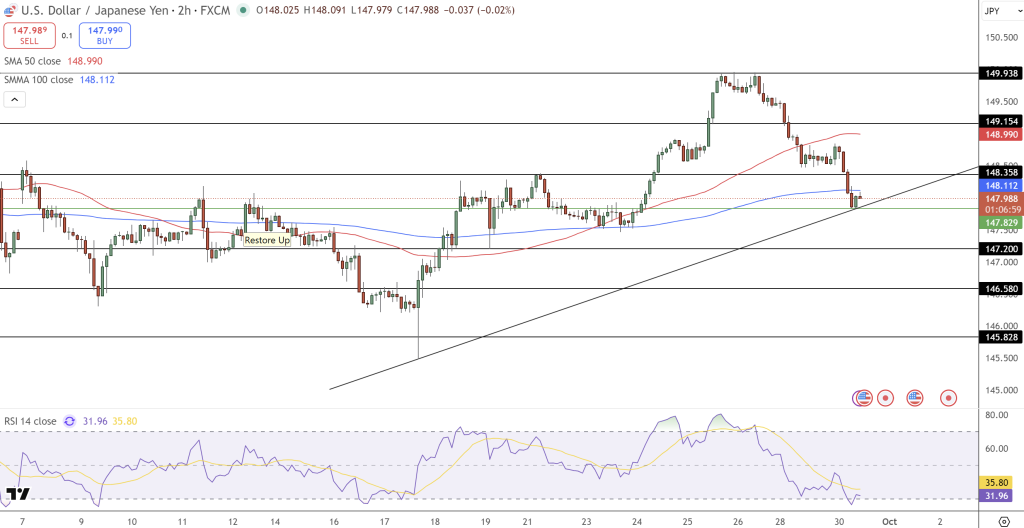
On the charts, USD/JPY is testing 148.00. Price has broken below the 50-SMA at 148.99 and is consolidating at the 100-SMA around 148.11. A sequence of lower highs and lows indicates weakening momentum.
-
Bearish: Shooting star at 149.93 followed by strong red bars = three black crows = more downside.
-
RSI: 32, oversold but not yet reversing.
Trade Scenarios:
-
Bearish: Below 147.80 could reach 147.20 and 146.58.
-
Bullish: Above 148.10 with a bullish engulfing candle could target 148.90-149.15.
For now, USD/JPY is at a key zone—whether the trendline holds or breaks will decide the next move. Wait for candle confirmation before entering.
- Check out our free forex signals
- Follow the top economic events on FX Leaders economic calendar
- Trade better, discover more Forex Trading Strategies
- Open a FREE Trading Account
- Read our latest reviews on: Avatrade, Exness, HFM and XM
Related Articles


Sidebar rates
Related Posts
