Bitcoin Hits $116K With $3.5B ETF Boost, $120K Target Now in Sight
Bitcoin (BTC) is up, breaking above $116,000 after consolidating in a rising channel for several days. At the moment, BTC is at $116,400...
Quick overview
- Bitcoin (BTC) has surged above $116,000, currently trading at $116,400, marking a 1.65% increase in 24 hours.
- The rally is supported by significant inflows into US spot Bitcoin ETFs, totaling $3.53 billion for September.
- Analysts suggest that the current accumulation and reduced miner selling indicate a bullish trend, with potential for BTC to reach $180,000 in Q4.
- Technical indicators show a golden cross, but caution is advised due to overbought conditions, suggesting a possible short-term pullback.
Bitcoin (BTC) is up, breaking above $116,000 after consolidating in a rising channel for several days. At the moment, BTC is at $116,400, up 1.65% in 24 hours and 6.2% in the last month. The move was driven by a strong green candle that closed above $114,865, showing renewed buying.
BTC is now facing resistance at $117,956 and $119,289, with a run to the psychological $120,300 if momentum holds. Year to date, Bitcoin’s market cap has gone from $870 billion to $1.07 trillion, that’s how big the institutional demand is.
Daily spot volume is down to $56.3 billion, -6% from the previous day, while futures volume is up. Coinglass data shows $80.95 billion in futures volume (+2%) and open interest steady at $81.79 billion, traders are being cautious but adding more leverage.
Uptober is Here
The rally is being supported by big inflows into US spot Bitcoin ETFs. According to SoSoValue, $429.9 million flowed in on September 30, second day in a row and September’s total is now $3.53 billion.
Breakdown of inflows:
- BlackRock’s IBIT: $199.4M
- Ark Invest’s ARKB: $105.7M
- Fidelity’s FBTC: $54.7M
No one is selling. Analysts say this accumulation, combined with reduced miner selling, is a sign of structural bullishness. CryptoQuant’s Carmelo Alemán even thinks BTC could go to $180,000 in Q4 if demand keeps up.
Bitcoin Technicals
On the charts, Bitcoin is in a clear higher low structure, accumulation is happening. 50-EMA ($112,810) just crossed above 200-EMA ($112,883) and that’s a golden cross that often means longer term strength.
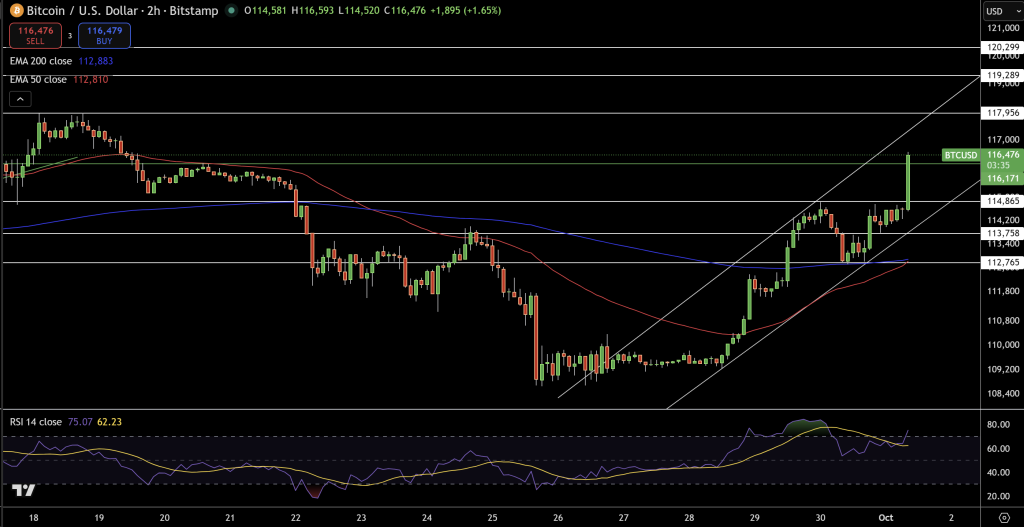
- Support: $114,800-$115,200, deeper at $113,700
- Resistance: $117,950, $119,300, $120,300
- RSI: 75, overbought and could consolidateBullish but be cautious. Overbought means short term pullback is possible, watch for shooting star or three black crows.
Trade: For newbies, patience is the key. A better entry will come on a dip to $114,800-$115,200, confirmed by a green candle like a hammer. Targets are $117,950 and $119,300, stop loss below $113,700. Aggressive traders can ride the current break out but RSI is overbought so risk management is a must.
- Check out our free forex signals
- Follow the top economic events on FX Leaders economic calendar
- Trade better, discover more Forex Trading Strategies
- Open a FREE Trading Account
- Read our latest reviews on: Avatrade, Exness, HFM and XM
Related Articles


Sidebar rates
Related Posts
