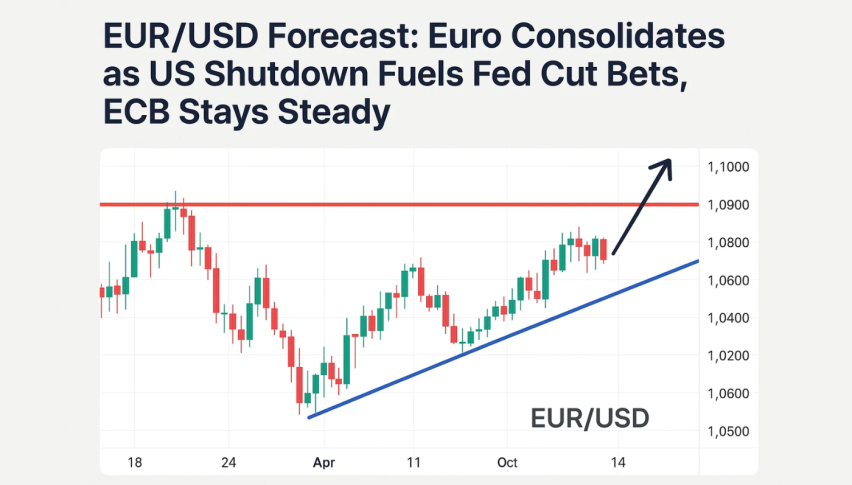
EUR/USD Forecast: Euro Consolidates as US Shutdown Fuels Fed Cut Bets, ECB Stays Steady
Friday European session, the EUR/USD pair is consolidating around $1.1735 after two days of declines. Traders are waiting for Eurozone...
Quick overview
- The EUR/USD pair is consolidating around $1.1735 after two days of declines, with traders awaiting key Eurozone data.
- ECB's Martins Kazaks indicated that current rates are appropriate and emphasized a flexible approach amid market uncertainty.
- The US dollar is facing pressure due to a government shutdown, leading to speculation of a dovish Fed and increased rate cut bets.
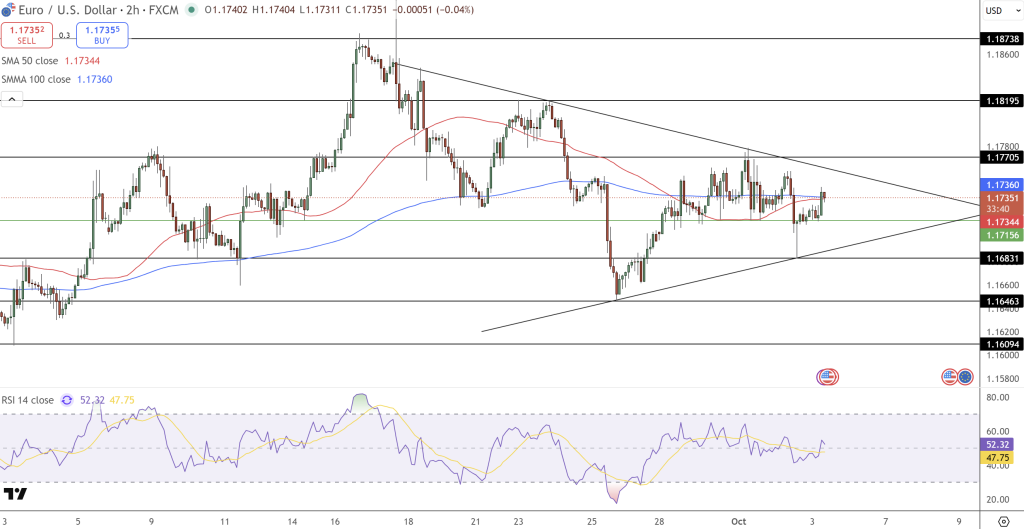
- Technically, EUR/USD is in a symmetrical triangle, with key support at $1.1715 and resistance at $1.1770, indicating indecision in the market.
Friday European session, the EUR/USD pair is consolidating around $1.1735 after two days of declines. Traders are waiting for Eurozone data, including HCOB Purchasing Managers’ Index (PMI) for Eurozone and Germany and Producer Price Index (PPI). These will give us growth and inflation numbers which are key for the ECB’s policy.
ECB Says No Change for Now
The euro got support after ECB’s Martins Kazaks said current rates are “very appropriate” and could stay the same for now. He emphasized the need for flexibility given the market uncertainty and the ECB will take a wait and see approach rather than rush into tightening. His comments reinforced that the ECB will prioritize stability until we get clearer signals.
Fed Rate Cut Bets Rise as US Shutdown Continues
The US dollar is under mild pressure as the government shutdown enters its third day, delaying key data releases such as Nonfarm Payrolls (NFP), ISM Services PMI and S&P Global Services PMI. This data vacuum is fueling speculation of a dovish Fed. CME FedWatch shows markets pricing in 97% chance of an October rate cut and 91% chance of another in December as weaker labor market numbers deepen the concerns about US growth.
EUR/USD Technical Analysis
Technically, EUR/USD is in a symmetrical triangle, with converging trendlines indicating a volatility squeeze. Price is at $1.1735, between the 50-SMA ($1.1734) and 100-SMA ($1.1736) and is indecisive. Support is at $1.1715 and resistance is at $1.1770.
Candlestick patterns are doji and spinning tops, a tug of war between buyers and sellers. RSI is 52, neutral but bullish, higher lows since late September. A break above $1.1770 could trigger a move to $1.1819 and $1.1873, especially if confirmed by strong bullish candles. Below $1.1715 could see a move to $1.1683 and $1.1646. For traders, waiting for a confirmed candle close beyond these levels is the way to go.
- Check out our free forex signals
- Follow the top economic events on FX Leaders economic calendar
- Trade better, discover more Forex Trading Strategies
- Open a FREE Trading Account
- Read our latest reviews on: Avatrade, Exness, HFM and XM
Related Articles


Sidebar rates
Related Posts
