Gold Hits $4,025 as Fed Cut Bets and ETF Inflows Spark Bullish Rally
Gold broke $4,000 for the first time ever this week, hitting $4,025 at 05:00 UTC on Wednesday. The move comes as expectations of US Fed...
Quick overview
- Gold has surpassed $4,000 for the first time, reaching $4,025 amid rising geopolitical tensions and expectations of US Fed rate cuts.
- Investors are increasingly turning to gold as a hedge against uncertainty, with prices up 53% this year.
- Technical indicators show a strong bullish trend for gold, with higher highs and lows, despite potential short-term resistance.
- Analysts suggest watching for minor pullbacks, with targets set between $4,065 and $4,100 as the market remains optimistic.
Gold broke $4,000 for the first time ever this week, hitting $4,025 at 05:00 UTC on Wednesday. The move comes as expectations of US Fed rate cuts, geopolitical unrest and a US government shutdown intensify. Investors are flocking to the metal as a hedge against uncertainty, up 53% this year.
Tai Wong, an independent metals trader, said “there’s so much faith in this trade right now that the market will look for the next big round number, which is $5,000” highlighting how persistent macro pressures – from rising global debt to reserve diversification – are driving the rally.
ETF inflows, central bank accumulation and political instability in France and Japan have created the perfect storm for gold. Analysts point out that the election of Japan’s Sanae Takaichi and expectations of deeper deficit spending has added to the “run it hot” trade theme.
Gold Technicals Remain Bullish
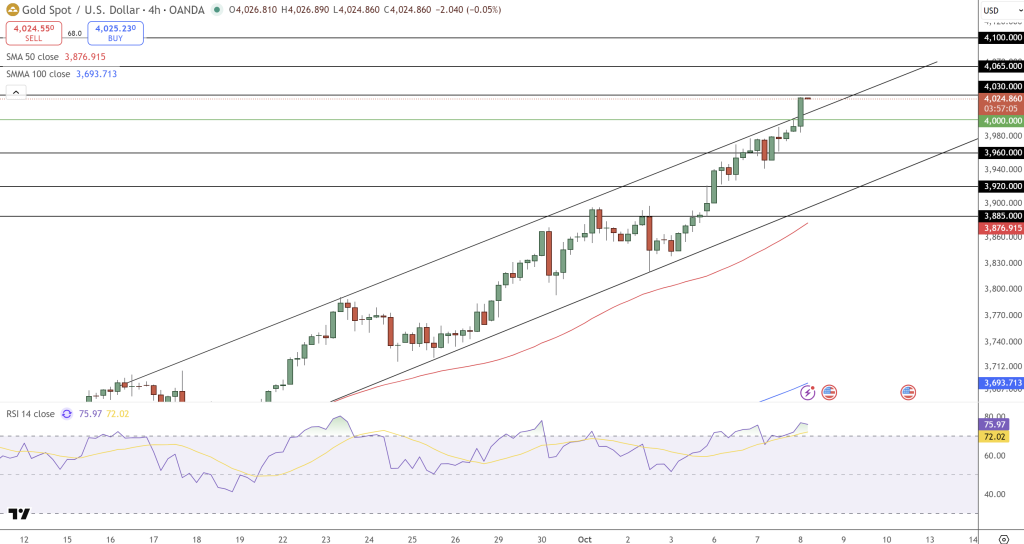
From a technical standpoint, gold is in a strong uptrend within a well defined ascending channel on the 4 hour chart. Price has printed higher highs and higher lows since late September and is showing sustained buyer control.
The latest 3 white soldiers – a bullish candlestick pattern – has taken out the $4,000 psychological level, showing strong continuation momentum. The upper wick of the latest candle near $4,030 shows some hesitation, so maybe some temporary resistance.
The RSI is 76, overbought, so maybe a short term cool down is due. But no bearish divergence has emerged and the 50-SMA ($3,876) is above the 100-SMA ($3,693) so medium term bullish control is intact.
What to Watch
UBS and Goldman Sachs have both raised their 2026 forecasts expecting ETF inflows and lower US yields to support prices. But short term traders should be aware of minor pullbacks.
Trade setup:
- Wait for a small pullback to $3,960-$3,980.
- Look for a bullish reversal candle to show buying interest is back.
- Target $4,065-$4,100, stop below $3,920.
In other words, the market is hot but still in control — the trend is still up and every dip to support is bringing in new buyers. Gold’s move isn’t just another breakout, it’s the market’s biggest call yet that the dollar will be soft and the world will be hungry for safety.
- Check out our free forex signals
- Follow the top economic events on FX Leaders economic calendar
- Trade better, discover more Forex Trading Strategies
- Open a FREE Trading Account
- Read our latest reviews on: Avatrade, Exness, HFM and XM
Related Articles


Sidebar rates
Related Posts
