A Trade Idea For EUR/USD – Is the Retrace Over?
Judging by the move, we can say that EUR/USD has been feeling really exhausted during October. It has slowly slipped lower but steadily, as if it was running out of energy. The retraces have been fairly shallow and anemic as well. In the last few days though, the buyers have been putting up a decent fight.
This has presented forex traders with a trading opportunity, so we thought we should let you know about it. If you have enough risk appetite you can consider it, but the risk/reward ratio is a bit too high for us, so we´re not opening a long term forex signal.
OK here it is;
If you look at the H4 forex chart below, you can see that the price has moved higher to the 50 moving average in yellow. This moving average provided strong support last week, after those strange comments from that strange ECB source.
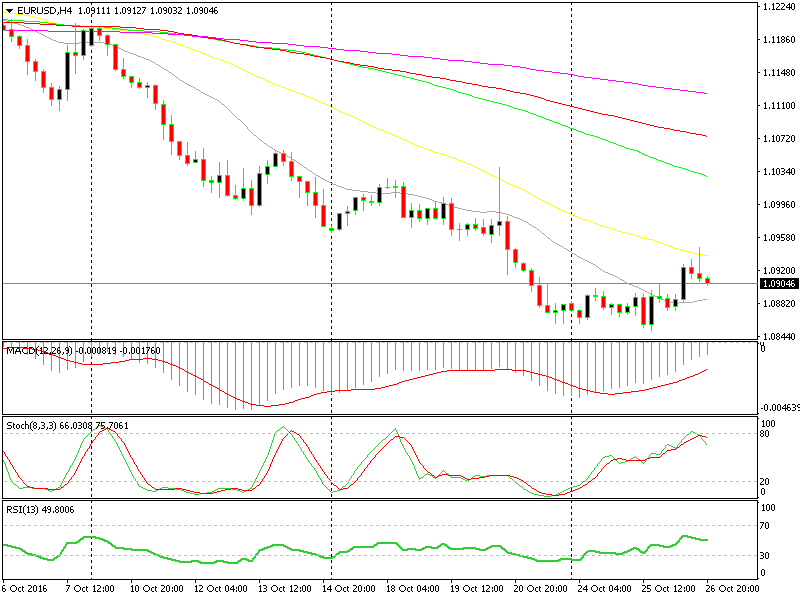
The 50 moving average might place a lid on this retrace
That´s the first strong signal that the retrace might be over. The stochastic indicator being oversold and already heading down is another signal. The third signal is the candlestick formation; the last two closed H4 candlesticks are a morning star and an upside-down hammer, which indicate a trend reversal.
These three signals would normally be enough for us, but as we said above we´re not taking this trade, at least not right now. You can find the reason (or three of them) on the daily chart. The daily EUR/USD chart paints a completely different picture compared to the H4 forex chart. It´s like a mirror reflecting the image upside down.
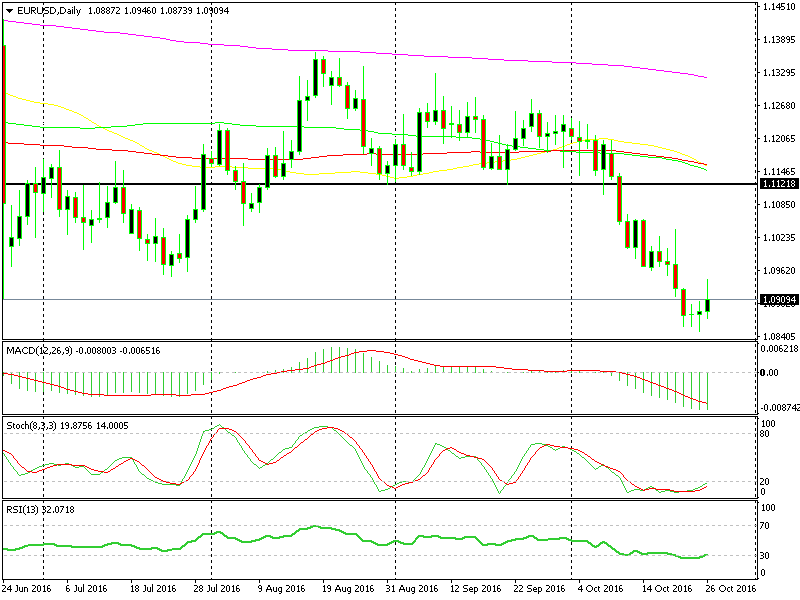
The daily chart points only one way, up
You can see that the stochastic and RSI indicators are oversold, right? Besides that, the last two closed daily candlesticks are dojis, which is a strong indicator that a reverse is soon to follow. Today the EUR/USD buyers tried to start the reverse and the daily candlestick seems bullish until now, but we´ll have to wait until the US trading session ends.
So, these are the daily and H4 EUR/USD charts contradicting each other. We don´t like opening trades when different timeframe forex charts paint different pictures and we also don´t like the risk/reward ratio. This might as well turn the best trade in the world; the retrace ends, the price turns down, an ECB member blabbers some dovish stuff and bang 1.05 here we come.
But, that doesn´t suit our type of trader psychology, so we´re going to pass on this one. Whoever decides to take it, make sure to keep the stop loss above the 50 moving average, probably in the 1.0950-60 region.
- Check out our free forex signals
- Follow the top economic events on FX Leaders economic calendar
- Trade better, discover more Forex Trading Strategies
- Open a FREE Trading Account
- Read our latest reviews on: Avatrade, Exness, HFM and XM
Related Articles
Sidebar rates
Related Posts
