AMD Stock Rockets 61% in Just Six Weeks: What Investors Need to Know

Quick overview
- AMD has surged approximately 61% in price over the past six weeks, attracting significant attention from traders.
- After a 66.3% correction, AMD rebounded 214% to reach a new all-time high of $240, supported by strong technical indicators.
- While short-term momentum shows signs of consolidation, the overall trend remains bullish with key resistance at $227-$240.
- Potential support levels for AMD are identified at $178 and $135, should a corrective pullback occur.
Advanced Micro Devices (AMD) has displayed explosive momentum over the past six weeks, surging approximately 61% in price. This rapid appreciation has drawn the attention of both institutional and retail traders, highlighting the stock’s strong short-term bullish trend.
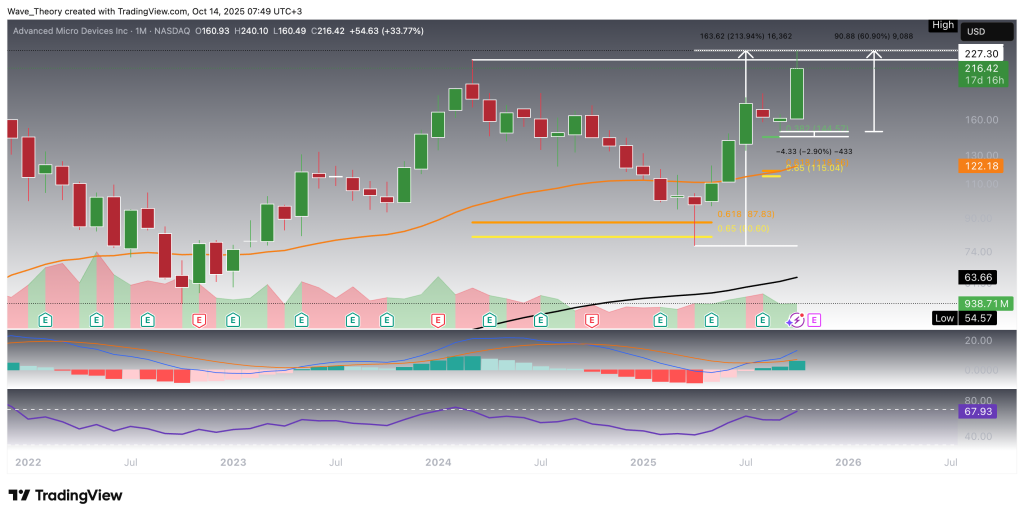
AMD Stock Skyrockets After Prolonged Correction Phase
From early 2024 to early 2025, AMD experienced a significant corrective phase, retracing approximately 66.3%, ultimately finding strong support at the golden ratio level of $80. At this critical juncture, the stock demonstrated a decisive bullish reversal, surging roughly 214% to establish a new all-time high at $240.
In the midst of this upward trajectory, AMD encountered a small corrective pullback, which briefly tested but missed the 0.382 Fibonacci support at $144.5 by roughly 3%, only to follow with an impressive 61% gain in a single month, highlighting the stock’s resilience and strong buying pressure.
On the monthly chart, technical indicators strongly support the long-term bullish outlook:
-
EMAs and MACD lines remain bullishly crossed, confirming a sustained upward trend.
-
The MACD histogram is exhibiting a robust uptrend, signaling strong bullish momentum.
-
RSI currently resides in neutral territory but is gradually approaching overbought regions, suggesting continued strength while cautioning that a short-term pullback could occur.
Overall, AMD’s recovery from a deep correction, combined with bullish trend confirmations across key technical indicators, reinforces a long-term bullish trajectory, while near-term momentum remains strong but increasingly stretched.
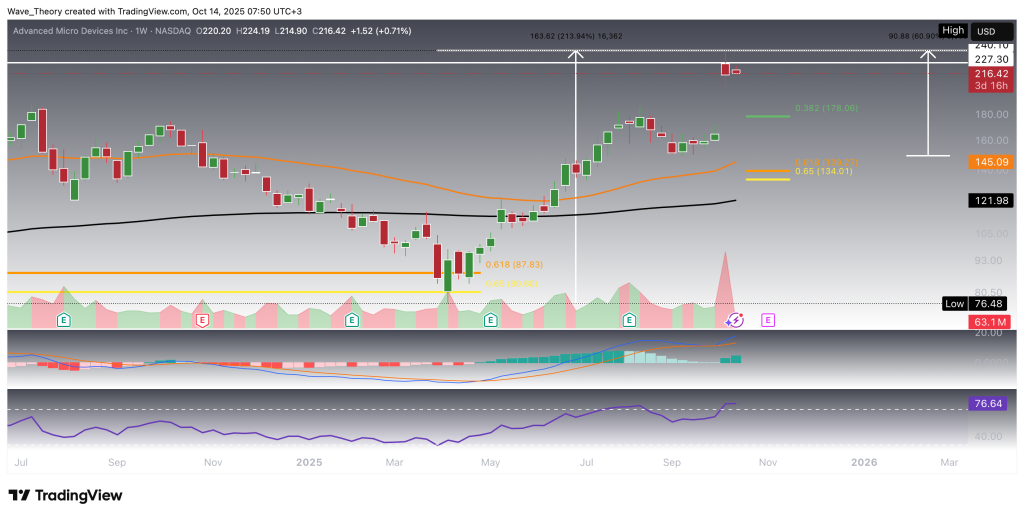
Bullish Indicators on AMD’s Weekly Chart
On the weekly chart, AMD continues to demonstrate strong bullish momentum:
-
EMAs are in a golden crossover, confirming a sustained upward trend in the mid-term.
-
MACD lines remain bullishly crossed, and the histogram has been ticking higher since last week, signaling ongoing buying pressure.
-
RSI is positioned in neutral territory, suggesting there is still room for further upside before overbought conditions emerge.
However, the stock now faces key resistance between $227 and $240. Should AMD encounter a bearish rejection at this zone, a corrective pullback could target the Fibonacci support levels at $178 and $135, respectively, providing potential entry points for medium-term buyers.
Overall, the weekly chart confirms a mid-term bullish trend, though traders should remain alert to resistance-induced corrections near the current highs.
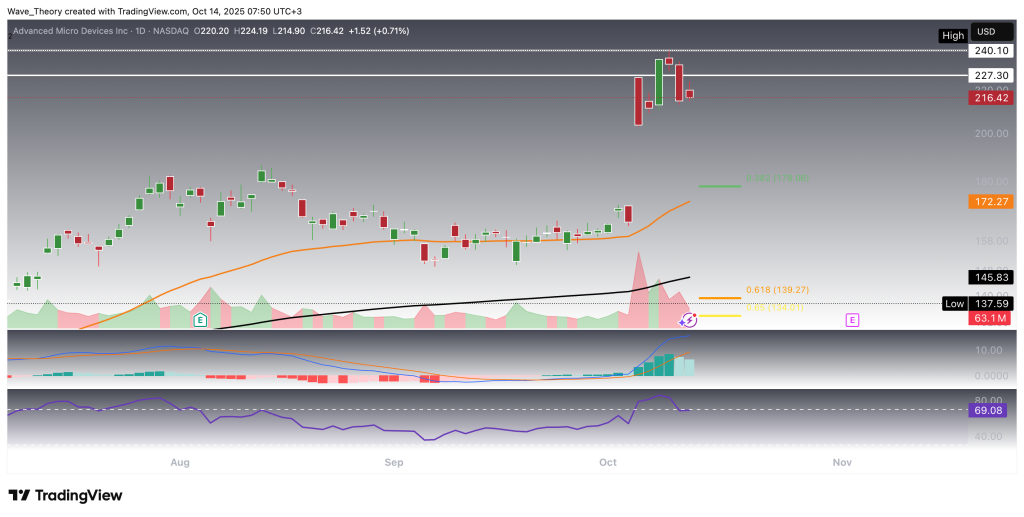
Bullish Momentum Fades Slightly in the Short-Term
On the daily chart, AMD shows signs of short-term consolidation, as bullish momentum has slightly waned:
-
The MACD histogram has begun to tick bearishly lower, reflecting a temporary slowdown in buying pressure over the past three days.
-
RSI has retreated to neutral territory after previously entering overbought regions, signaling that the stock is pausing after a strong advance.
Despite this short-term cooling, MACD lines and EMAs remain bullishly crossed, confirming that the short- to medium-term trend remains intact. This suggests that while minor pullbacks or consolidation may occur, the underlying momentum continues to favor higher prices in the coming weeks.
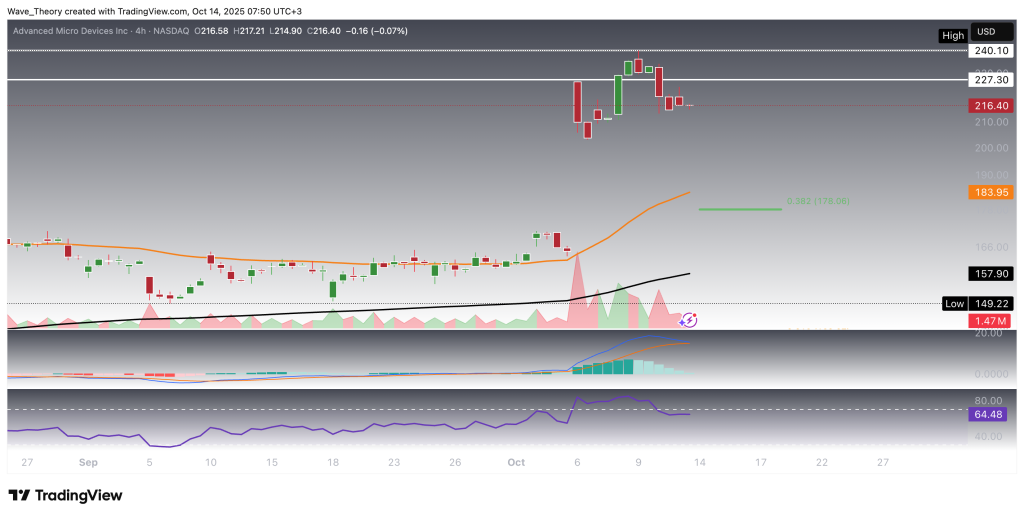
Similar Outlook on the 4H Chart
On the 4-hour chart, AMD exhibits a similar short-term consolidation pattern:
-
The MACD histogram is declining, signaling a temporary slowdown in bullish momentum.
-
MACD lines and EMAs remain bullishly crossed, confirming that the prevailing trend is still upward.
-
RSI has returned to neutral regions, indicating that the stock is no longer overextended.
Should AMD experience a short-term correction, the most likely support target is at $178, aligning with key Fibonacci retracement levels and previous consolidation zones.
AMD Stock Technical Summary
Trend Overview:
AMD has rebounded impressively from a deep corrective phase (−66.3% to the $80 golden ratio level) and surged roughly 214% to a new all-time high of $240. Monthly and weekly charts confirm a long-term and mid-term bullish trend, supported by bullishly crossed EMAs and MACD lines. Short-term momentum shows slight consolidation, but the overall trend remains intact.
Key Indicators:
-
MACD histogram: Strong uptrend on monthly/weekly charts; minor decline on daily/4H charts.
-
RSI: Neutral on monthly/weekly; returning from overbought to neutral in daily/4H.
Immediate Resistance:
-
$227–$240 (recent highs / ATH zone)
Key Support / Fibonacci Levels:
-
$178 – short-term and 4H support
-
$135 – deeper Fib support
Outlook:
-
Short-term: Minor consolidation or pullback possible; trend remains bullish.
-
Mid- to long-term: Momentum and trend indicators support continued upside, though near-term resistance at $227–$240 may induce temporary pauses or corrections.
- Check out our free forex signals
- Follow the top economic events on FX Leaders economic calendar
- Trade better, discover more Forex Trading Strategies
- Open a FREE Trading Account
- Read our latest reviews on: Avatrade, Exness, HFM and XM
Related Articles


Sidebar rates
Related Posts
