TSM Hits New All-Time High — Is a Correction Coming Soon?
Quick overview
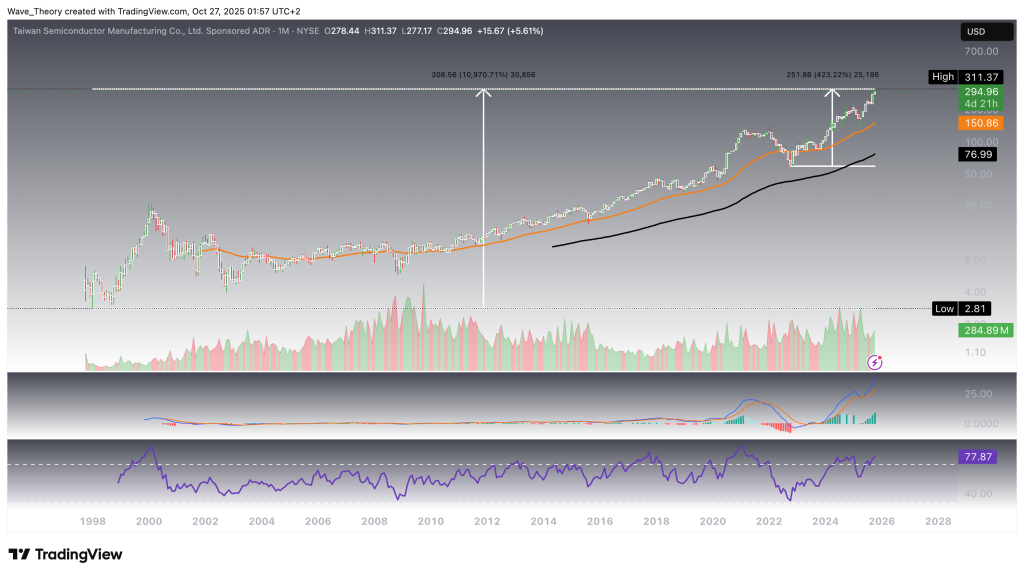
- TSM has experienced an impressive 11,000% increase since its NYSE listing in 1998, with a significant recovery of over 423% from its 2022 low.
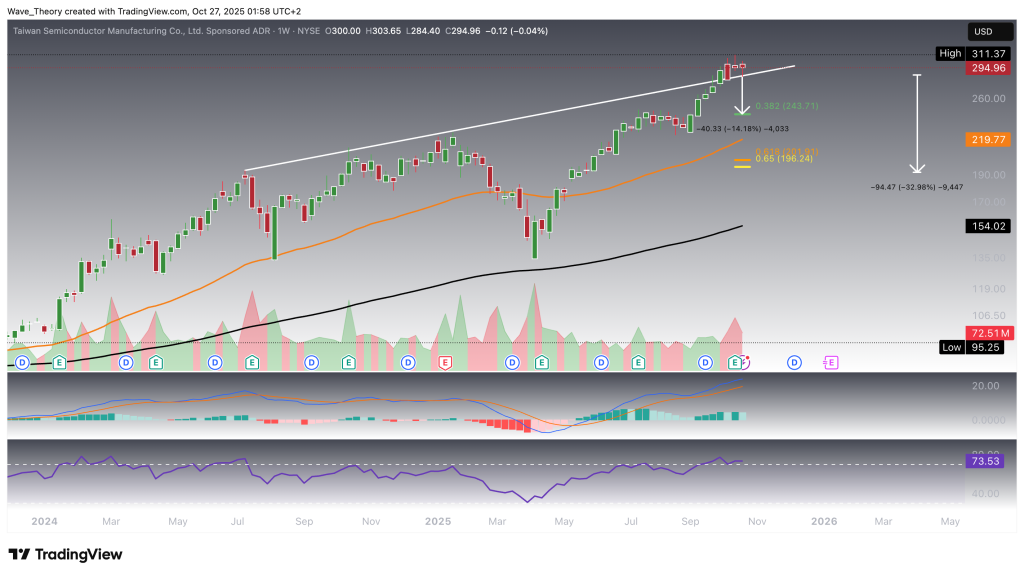
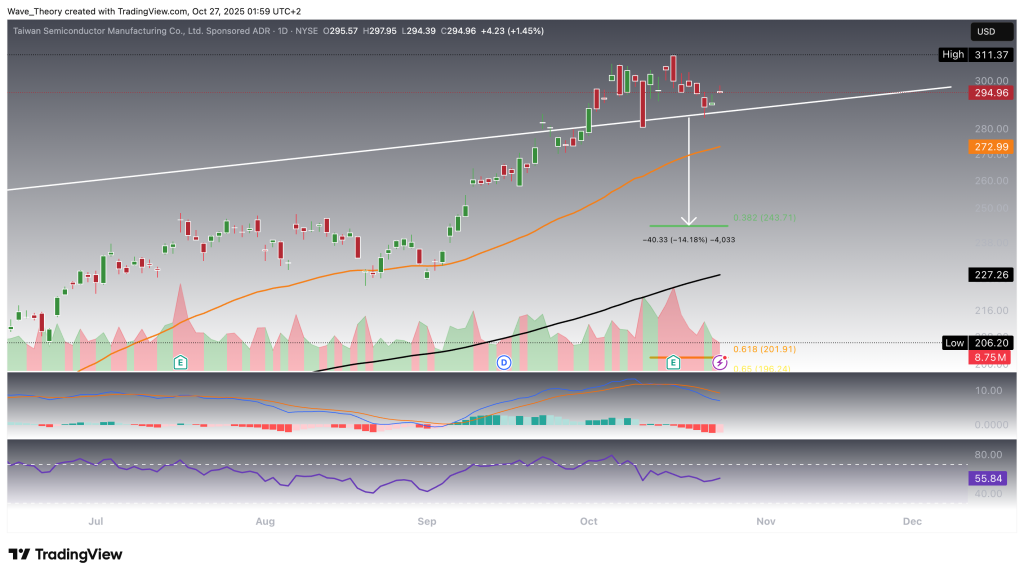
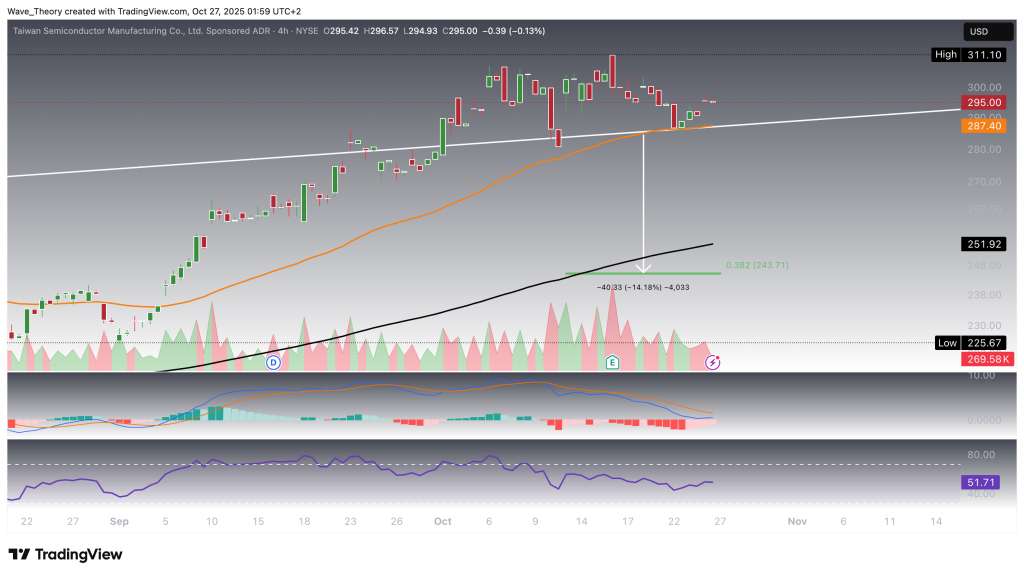
- Despite its long-term bullish trend, TSM is showing signs of waning momentum and may face a near-term correction with key support levels at $285 and $273.
- Technical indicators present a mixed outlook, with bullish EMAs but bearish MACD signals suggesting potential indecision in the market.
- Resistance levels are anticipated near $320 and $350, with a break above $350 likely confirming a continuation of the upward trend.
Taiwan Semiconductor Manufacturing Company Limited (TSM) has continued its remarkable rally, breaking past previous all-time highs month after month. As the stock maintains its strong momentum, investors are now asking: Can TSM sustain this powerful uptrend, or is a near-term correction on the horizon?
TSM Surged by Roughly 11,000% Since Listing on the NYSE
Since its listing on the NYSE in 1998, Taiwan Semiconductor Manufacturing Company (TSM) has exhibited an extraordinary long-term uptrend, appreciating by approximately 11,000%. Following an extended correction phase during the COVID-19 pandemic, the stock established a temporary bottom at $59.4 in 2022. Since then, TSM has resumed its upward trajectory, gaining over 423% from that low. On the monthly chart, both the MACD lines and EMAs remain bullishly crossed, reinforcing the prevailing long-term bullish trend. Additionally, the MACD histogram continues to display a strong upward momentum, while the RSI has entered overbought territory without issuing any immediate bearish divergences.

TSM Stock Now Finds Significant Support
Over the past three weeks, TSM has struggled to extend its rally, indicating waning bullish momentum. The stock now finds key support at the previous trendline resistance near $285. Should this level fail to hold, TSM could retrace toward the 0.382 Fibonacci support at $244, representing a potential 14.2% downside. Further below, additional support is established at the 50-week EMA around $220, while a breakdown of that level could lead to a deeper correction toward the golden ratio support near $200, implying a total drawdown potential of roughly 33%.
From an indicator perspective, the MACD histogram has begun to tick lower, suggesting a potential short-term cooldown. However, both the MACD lines and EMAs remain bullishly aligned, maintaining confirmation of the broader mid-term uptrend. Meanwhile, the RSI hovers near overbought territory, yet it currently issues no decisive bullish or bearish signals.

Mixed Signals on the TSM Daily Chart
On the daily timeframe, TSM exhibits a blend of bullish and bearish indications, reflecting ongoing market indecision. The EMAs continue to display a golden crossover, confirming the short-term uptrend. However, the MACD lines have crossed bearishly, while the RSI remains neutral, suggesting a pause in momentum. Interestingly, the MACD histogram has started to tick higher, hinting at a possible short-term bullish reversal.
Despite this, price action indicates that TSM is currently undergoing a correction. Should the trendline support fail to hold, the stock would likely find its next key support at the 50-day EMA around $273. A sustained break below this level could open the door for further downside consolidation before any potential recovery.

Similar Outlook on the TSM 4H Chart
On the 4-hour chart, TSM is currently holding above significant support at the 50-4H EMA around $287.4. A confirmed break below this level could trigger further downside toward the 0.382 Fibonacci retracement at $249, representing a deeper short-term correction.
The technical indicators present a mixed outlook on this timeframe. The EMAs continue to exhibit a golden crossover, confirming the short-term bullish structure. Meanwhile, the MACD histogram is ticking higher, signaling a potential recovery in momentum, while the RSI remains neutral, indicating neither overbought nor oversold conditions. However, the MACD lines have crossed bearishly, suggesting that upward momentum is not yet fully restored.

Summary & Outlook
TSM remains in a strong long-term uptrend, supported by bullish EMAs and a positive MACD structure on higher timeframes. However, short-term momentum has weakened, and a correction phase appears likely before continuation.
Key support levels to watch are:
-
$285 – previous trendline resistance, now acting as immediate support.
-
$273 – 50-day EMA and first major daily support.
-
$244 – 0.382 Fibonacci retracement, deeper correction target.
-
$220–200 – strong confluence zone with the 50-week EMA and golden ratio support.
To the upside, resistance is expected near $320 and $350. A break above $350 would likely confirm trend continuation toward new all-time highs.
- Check out our free forex signals
- Follow the top economic events on FX Leaders economic calendar
- Trade better, discover more Forex Trading Strategies
- Open a FREE Trading Account