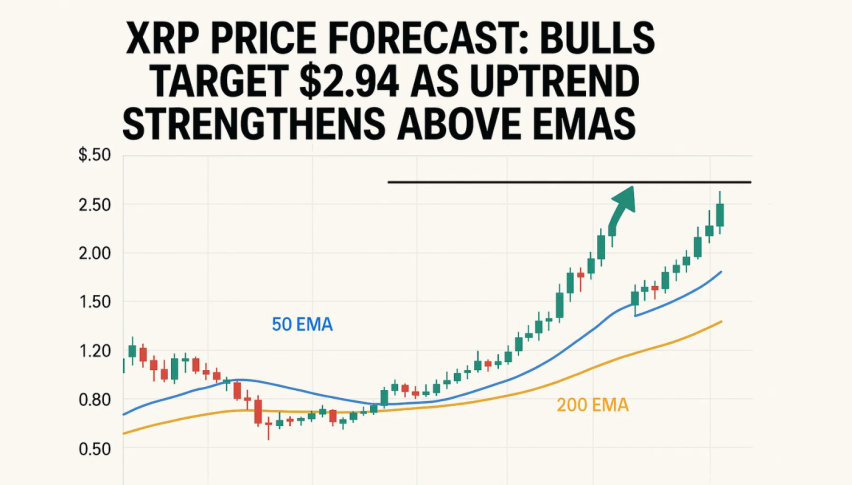
XRP Price Forecast: Bulls Target $2.94 as Uptrend Strengthens Above EMAs
Ripples XRP is trading at around $2.65 and it's on an upward trajectory, thus keeping pace after it reclaimed its 50-day EMA...
Quick overview
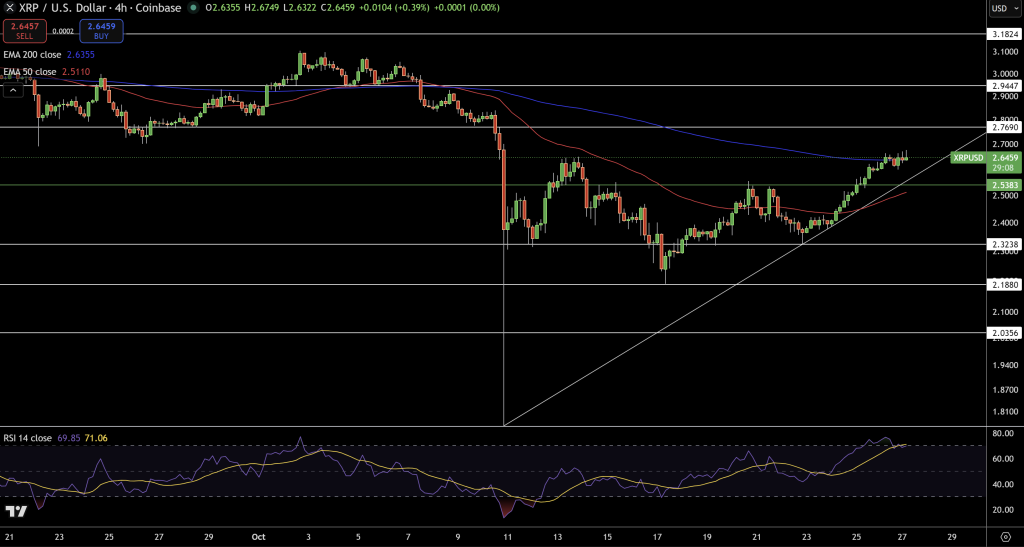
- Ripples XRP is currently trading at approximately $2.65, having reclaimed its 50-day and 200-day EMAs, indicating renewed buying interest.
- The Relative Strength Index (RSI) is at 70, suggesting the market is slightly overbought, which may lead to profit-taking.
- A breakout above $2.70 could pave the way for XRP to reach the $2.90 target, while a close below $2.54 would weaken bullish momentum.
- Active traders should consider entering on a confirmed breakout above $2.70 with a target range of $2.90–$2.94 and a stop loss below $2.53.
Ripples XRP is trading at around $2.65 and it’s on an upward trajectory, thus keeping pace after it reclaimed its 50-day EMA, which was at $2.51, & also its 200-day EMA, which was at $2.63. This crossover signals renewed buying interest and a clear shift in short-term sentiment. Looking at the 4-hour chart, we see a series of higher lows, which highlights that buyers are consistently absorbing supply as we see dips.
The upward trendline has added to XRP’s technical strength & shows steady demand despite periodic pauses. XRP’s recent candles have shown some hesitancy near the $2.70 resistance, a key level from mid-October’s consolidation zone, where supply was seen & buyers absorbed the dips.
Still Feeling a bit Overbought
The Relative Strength Index (RSI) is at 70—indicating the market is a bit overbought. However, this may cause some profit-taking. We don’t see any bearish divergence yet, which suggests the bigger-picture uptrend remains intact. A pullback to the $2.54–$2.58 range could give the market a chance to cool off a bit before potentially continuing higher.
Recent candle formations, particularly a three-white-soldiers followed by a spinning top, suggest that momentum will stall briefly before resuming its upward leg.
Key Resistance Breakout
If XRP breaks above $2.70, we can expect it to clear the path towards $2.9, the upper boundary of XRP’s prior trading range. If it stays above that level, then we can expect it to have a positive effect on extending the upside in the coming days. On the other hand, a close below $2.54, which, by the way, coincides with the trendline, would weaken the bullish control & expose the next key level of support at $2.32.
Trade Setup for Active Traders
- When to enter: On a confirmed breakout above $2.70 with decent volume
- Target : $2.90–$2.94 range
- Stop loss: Below $2.53
- Risk/reward: around 1:2
As long as the EMAs are going up & the trendline is intact, XRP is set to continue going up as long as the bulls can defend the key support levels.
- Check out our free forex signals
- Follow the top economic events on FX Leaders economic calendar
- Trade better, discover more Forex Trading Strategies
- Open a FREE Trading Account
- Read our latest reviews on: Avatrade, Exness, HFM and XM
Related Articles


Sidebar rates
Related Posts
