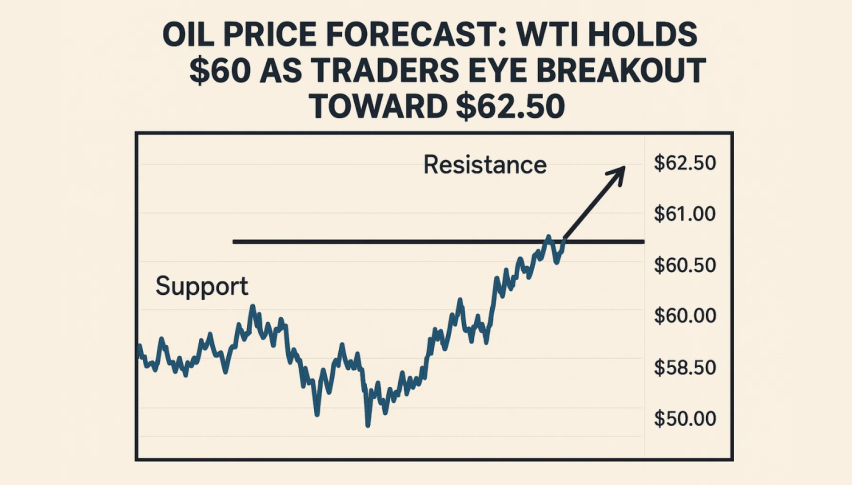
Oil Price Forecast: WTI Holds $60 as Traders Eye Breakout Toward $62.50
WTI Crude Oil is trading around $60.16, at least for now, it's steady after a strong bounce back from the $55.96 low it hit in the early...
Quick overview
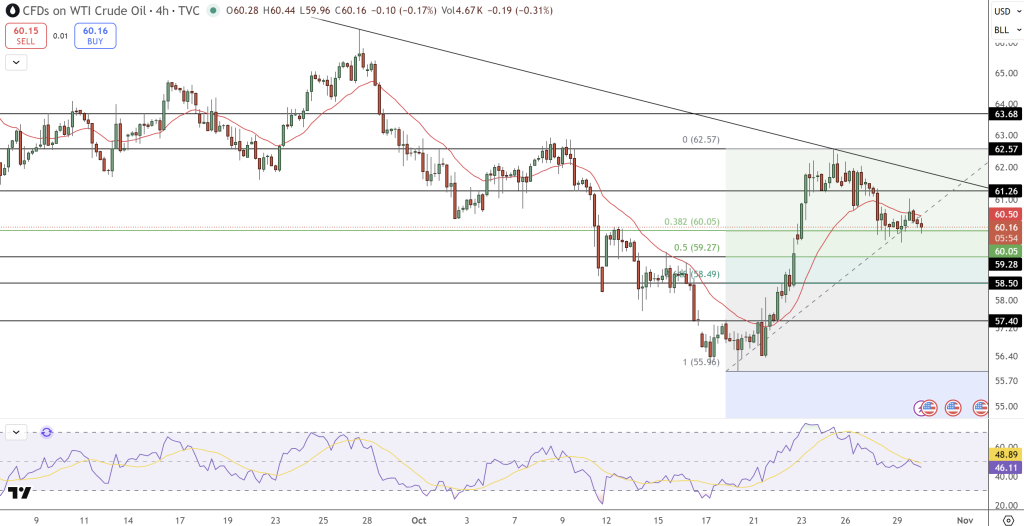
- WTI Crude Oil is currently trading around $60.16 after recovering from a low of $55.96 earlier this month.
- The price is consolidating with resistance at $61.26 and support levels around $59.27, indicating indecision among traders.
- Geopolitical tensions and potential Fed interest rate cuts are contributing to a cautiously optimistic outlook for energy demand.
- Traders should watch for a breakout above $60.50 or a drop below $59.20 to determine the next price movement.
WTI Crude Oil is trading around $60.16, at least for now, it’s steady after a strong bounce back from the $55.96 low it hit in the early part of this month. The momentum has definitely slowed down now as traders take a look at the mixed signals—a slight worry about demand on the one hand and OPEC’s production controls on the other.
Oil’s immediate price movement is showing a pause within a consolidation zone, with a fairly firm resistance forming around $61.26. This is where the trendline from above & 38.2% Fibonacci retracement ($60.05) intersect. You know how it is: this sort of technical cluster often serves as a pivot point for traders to decide whether the trend’s going to keep moving up or down.
The bigger picture, though, remains cautiously optimistic – all because of geopolitical tensions & the expectation that the Fed might cut interest rates, which in turn could give a bit of a boost to energy demand through improved liquidity.
Technical Outlook: Momentum Cools
On the 4-hour chart, the 50-period EMA has flattened out after weeks of bouncing back. It’s a sign that the bullish momentum has slowed right down. The price candles have got spinning tops & long wicks—that’s a bit of a sign that traders are still undecided about what to do. Meanwhile – the RSI is coming down from overbought to about neutral – it’s not really feeling weak yet though.
But despite the momentum slowdown, WTI is still forming higher lows—that’s a sign that buyers are actually pretty keen on holding key levels. There’s one zone in particular you need to keep an eye on – that’s the $59.27 – $59.00 zone. If it holds above that, then the broader uptrend should be okay.
Key Levels to Watch
These are the main technical areas to keep an eye on right now:
- Resistance levels around $61.26 and $62.57
- Support around $59.27, $58.50, and $57.40
- RSI Recovery above 50 – that could actually confirm a bullish breakout
If the price breaks through $60.50 then WTI’s going to test $61.26 and then $62.57. But if it drops below $59.20, you might see some selling pressure build up, heading towards $58.50.
WTI Crude Oil Trade Setup: Breakout or Pullback Ahead
If you’re looking for a long trade, look for a break above $60.50 and then aim for $61.26 and $62.57. You’d want to put a stop-loss in below $59.20 – that way you’re not giving up too much if it all goes wrong. Of course, if you’re short, look for a drop below $59.20—take it all the way down to $58.50-$57.40.
WTI’s current range suggests traders are waiting for real conviction before deciding where to go next. Whether it’s a breakout or another little pullback, the reaction at $60 will be important in defining its path for November.
- Check out our free forex signals
- Follow the top economic events on FX Leaders economic calendar
- Trade better, discover more Forex Trading Strategies
- Open a FREE Trading Account
- Read our latest reviews on: Avatrade, Exness, HFM and XM
Related Articles


Sidebar rates
Related Posts
