Tesla (TSLA) stock has pulled back 12.6% this month after reaching a local high of $467, with key support levels at $390 and $340.
Despite the recent decline, momentum indicators suggest underlying bullish strength, particularly on the monthly chart with a bullish MACD crossover.
The weekly and daily charts show mixed signals, with significant support at $414.5 and $412.4, indicating potential for further downside if these levels are breached.
Overall, while TSLA remains in a bullish mid-term trend, short-term signals indicate a possible continuation of the correction before a renewed upward movement.
Tesla (TSLA) stock has seen a notable pullback this month, yet bullish investors are showing renewed strength as momentum begins to shift in their favor.
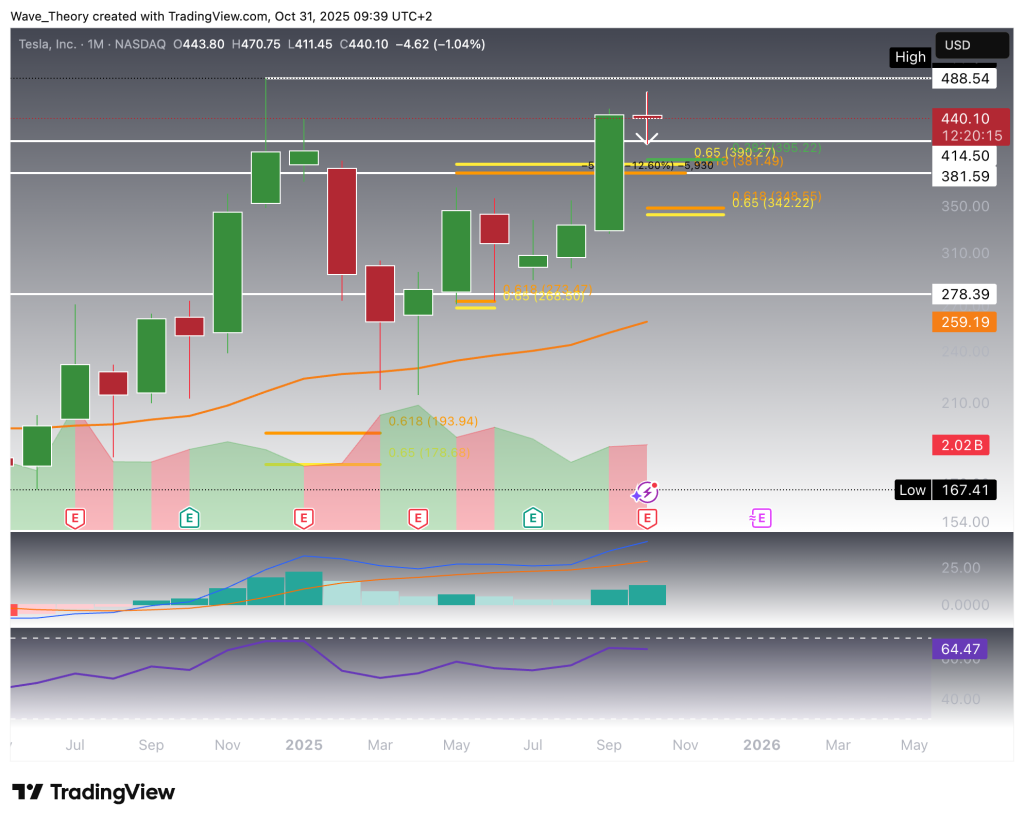
Tesla Stock Pulls Back 12.6% After Local High — Key Technical Levels in Focus
Tesla (TSLA) has declined by 12.6% this month after establishing a local high at $467. The stock currently remains in a corrective phase, with major Fibonacci support levels positioned around $390 and $340.
A bearish break below these key supports could extend the downside toward the 50-month EMA near $259, marking a potential long-term retracement zone.
Despite the short-term weakness, momentum indicators show resilience. On the monthly timeframe, the MACD lines remain bullishly crossed, and the MACD histogram has continued to tick higher since last month — signaling underlying positive momentum. Meanwhile, the RSI is approaching overbought territory, suggesting that while bullish strength persists, a period of consolidation may be necessary before further upside continuation.
Tesla
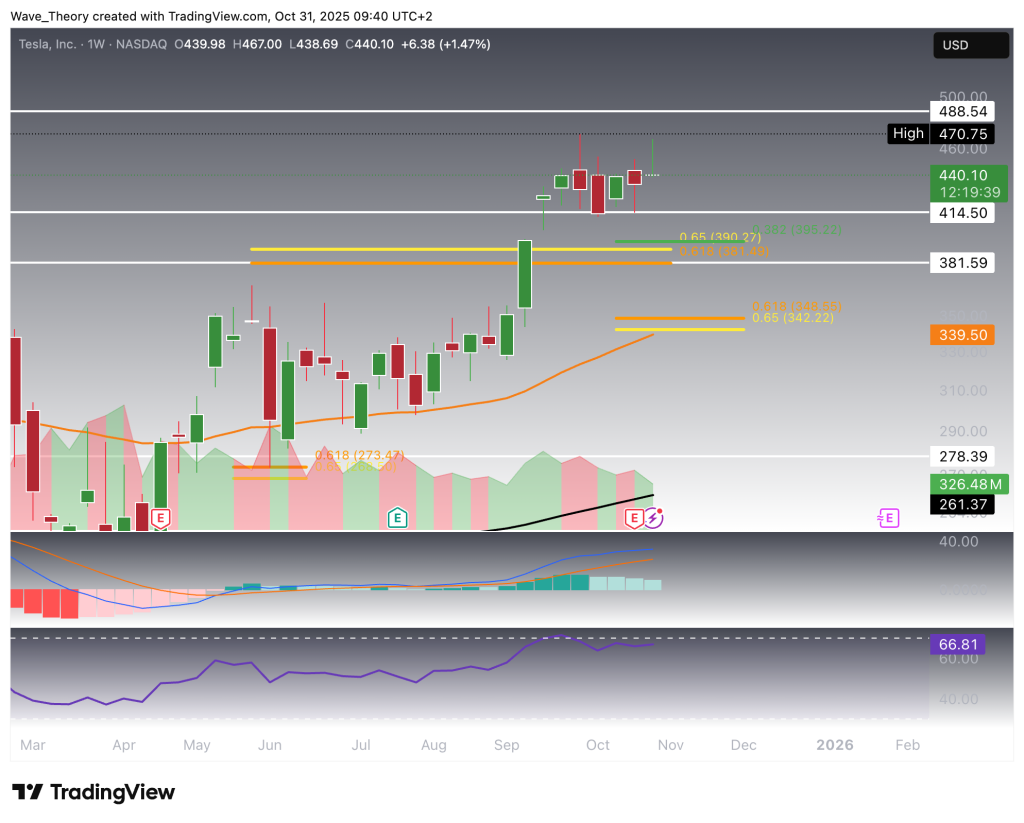
Tesla Stock Tests Key Support as MACD Momentum Softens
On the weekly chart, Tesla (TSLA) continues to show mixed technical signals. The MACD lines remain bullishly crossed, reflecting sustained upward momentum, yet the MACD histogram has been ticking bearishly lower for the past four weeks, suggesting a gradual loss of buying strength.
Meanwhile, the RSI hovers in neutral territory, indicating equilibrium between buyers and sellers. The exponential moving averages (EMAs) continue to exhibit a golden crossover, confirming the mid-term trend remains bullish despite recent weakness.
At present, TSLA finds substantial support at $414.5. A decisive break below this level could open the door for a deeper pullback toward the lower boundary of the support zone at $381.6, where renewed buying interest may emerge.
Tesla
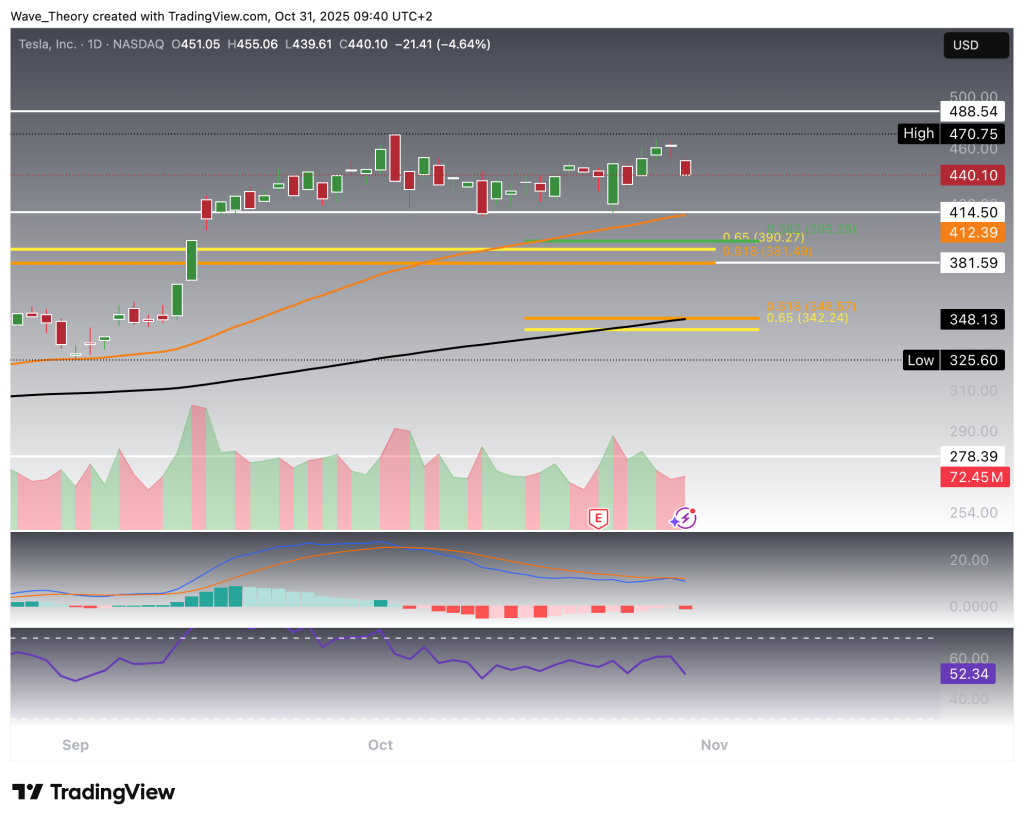
The Daily Chart Finds Major Support At The 50- and -200-Day-EMA
The daily chart shows a golden crossover, which confirms the trend bullishly in the short-to medium term. If Tesla continues the downturn, it finds its next significant support levels at $412.4 and $348. The 200-day-EMA is at the golden ratio support at $345, which serves as major support. That being said, the MACD lines are bearishly crossed, while the MACD histogram is ticking bearishly lower today. The RSI moves in neutral regions.
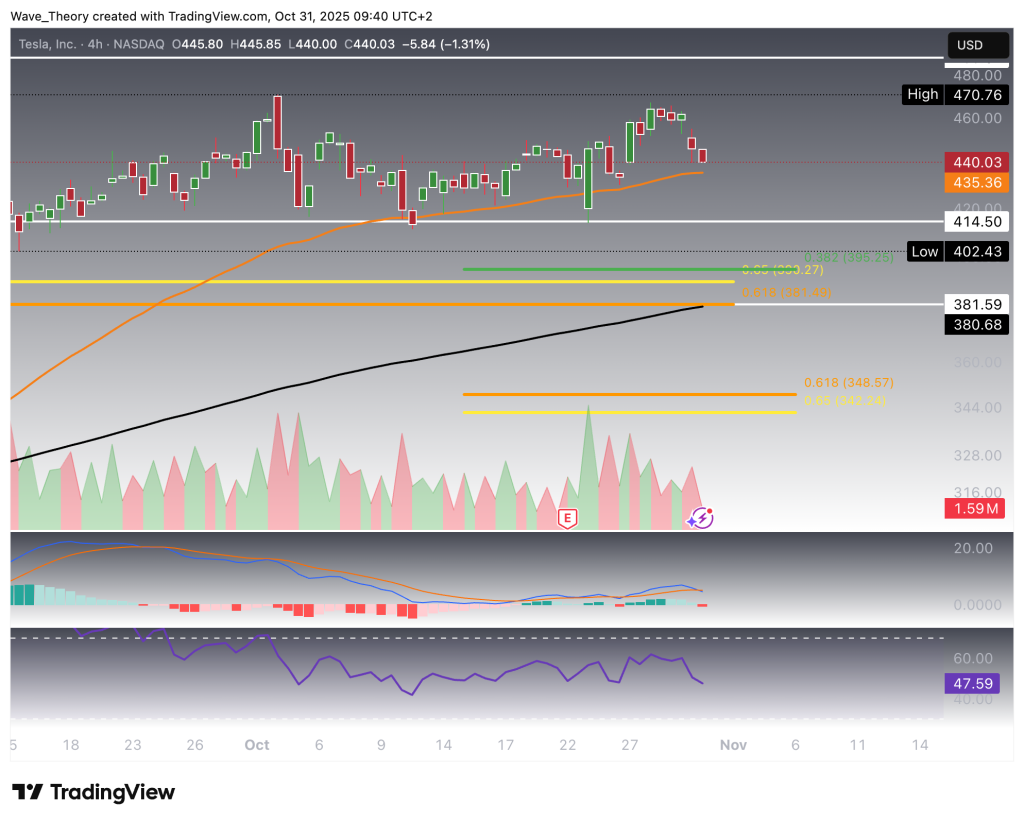
The 4-hour chart presents a mix of bullish and bearish signals, underscoring short-term indecision in Tesla’s (TSLA) price action. The EMAs maintain a golden crossover, confirming that the broader short- to medium-term structure remains bullish.
However, momentum has turned negative in the near term — the MACD lines have crossed bearishly, and the MACD histogram continues to tick lower, reflecting waning buying pressure. Meanwhile, the RSI holds within neutral territory, indicating neither overbought nor oversold conditions.
At present, TSLA is holding key support around $435. A bearish breakdown below this level could trigger further downside toward the next major support zone near $381, where buyers may look to re-enter.
Tesla
Tesla (TSLA) Technical Summary
Tesla stock has corrected 12.6% this month after reaching a local high near $467. Despite the pullback, the broader trend remains structurally bullish, supported by golden crossovers across multiple timeframes.
On the monthly chart, major support lies at $390 and $340, with the 50-month EMA providing a deeper floor around $259. The weekly chart identifies key support at $414.5, followed by $381.6, as the MACD histogram trends lower despite a still-bullish crossover. On the daily timeframe, the 50- and 200-day EMAs align near $412.4 and $345, forming a strong confluence of support. The 4H chart shows short-term indecision, with immediate support at $435, and deeper structure near $381 if that level breaks.
Overall, TSLA remains in a bullish mid-term trend, but the short-term momentum signals a potential continuation of the correction before a renewed push higher.
Konstantin Kaiser comes from a data science background and has significant experience in quantitative trading. His interest in technology took a notable turn in 2013 when he discovered Bitcoin and was instantly intrigued by the potential of this disruptive technology.