Solana Eyes $172 Breakout as SOL Staking ETFs Get US Regulatory Clarity
At the time of writing, Solana (SOL) is trading above $165. It has dropped about 1% in the last 24 hours as the cryptocurrency settles down
Quick overview
- Solana is currently trading above $165, having dropped about 1% in the last 24 hours after recovering from a low of $145.
- The U.S. Treasury's new guidance allows Wall Street-traded cryptocurrencies to provide staking dividends, clarifying regulations for institutional fund managers.
- Institutional interest in Solana is growing, with $118 million in inflows last week, contributing to a total of $2.1 billion over the past nine weeks.
- Technical analysis indicates a bullish continuation for Solana, with key resistance levels at $172 and $175, while support is seen at $165 and $162.
At the time of writing, Solana SOL/USD is trading above $165. It has dropped about 1% in the last 24 hours as the cryptocurrency settles down after a big comeback from its recent low of $145. The market is stabilizing, but there are some big changes in the rules that might have a big effect on how institutions use proof-of-stake networks.
Historic Treasury Guidance Opens Door for ETF Staking Rewards
The U.S. Treasury Department and Internal Revenue Service made a big announcement on Monday that Wall Street-traded cryptocurrencies can now provide staking dividends for investors. This is a big deal for the cryptocurrency business. The new safe harbor clause clears up a lot of regulatory confusion that had kept institutional fund managers from delivering staking rewards through exchange-traded instruments.
The guidance makes it clear what investment trusts need to do to stake digital assets without getting into trouble with the law or taxes. For example, trusts can only hold one type of digital asset from a permissionless proof-of-stake blockchain, they have to follow certain liquidity rules, and they have to use independent custodians and staking providers.
Scott Bessent, the U.S. Treasury Secretary, supported the action, saying it gives “a clear path to staking digital assets on Wall Street” while keeping America at the top of the world in blockchain technology. This move comes after suggestions from President Trump’s Council of Advisors for Digital Assets and is a big change from the last administration’s cautious view on staking rewards.
Solana’s Institutional Capital Flows Signal Growing Confidence
There is a lot of institutional interest in Solana, which is helping it recover. Last week alone, the network saw $118 million in inflows. This raises the total amount of money that has come in over the past nine weeks to $2.1 billion and $3.3 billion so far this year. This shows that institutions are still interested in the market even if prices have been going up and down a lot lately.
The cryptocurrency has bounced back about 10% from its low of $145. It is now trading at about $169, down 25% from local highs near $188. This trend of recovery shows that buyers are becoming more interested at lower levels and that long-term investors may be buying more.
SOL/USD Technical Analysis: Rising Channel Formation Points to Bullish Continuation
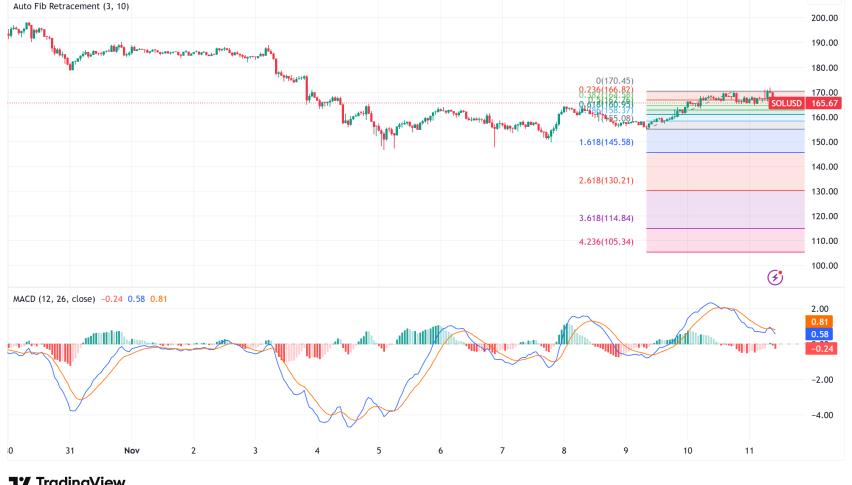
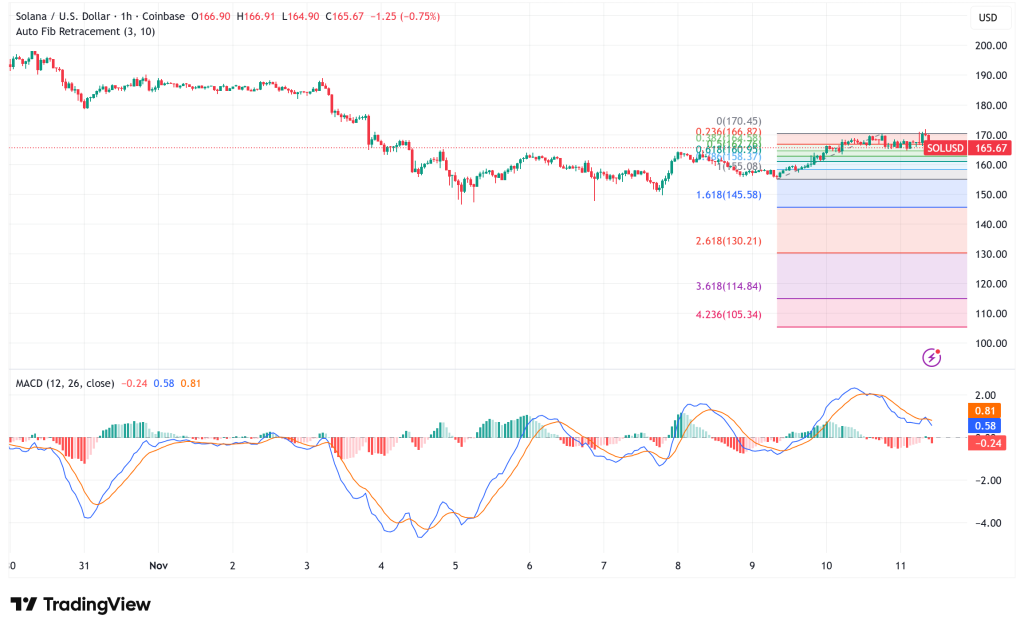
On the hourly chart, Solana’s price action shows a rising channel formation. The first level of resistance is at $172, while the second level is near $175. The cryptocurrency is trading above both the $165 level and the 100-hour simple moving average, which means that it is likely to go up in the immediate term.
The hourly MACD is picking up speed in the bullish zone, and the Relative Strength Index is staying above the 50 level, which suggests that momentum is still in buyers’ favor.
The current price is at a 61.8% Fibonacci retracement level of the downward move from the $188 swing high to the $145 low. This is a technically important level that typically decides whether a trend will continue or change direction.
Solana Price Prediction: Key Levels to Watch
- Bullish Scenario: If the price breaks over $172, it could advance toward the rising channel barrier around $175, with the major resistance objective at $188. A closing above $188 would confirm that the market is still going up, and it might go to $202 and then $220 in the medium term.
- Bearish Situation: If the price doesn’t break through the $172 barrier, it could test the $165 level again, and then the first significant support at $162. If prices fall below $162, the $155 support zone would be exposed. If prices keep falling, they might go as low as $150.
- Check out our free forex signals
- Follow the top economic events on FX Leaders economic calendar
- Trade better, discover more Forex Trading Strategies
- Open a FREE Trading Account
- Read our latest reviews on: Avatrade, Exness, HFM and XM
Related Articles

Sidebar rates
Related Posts
